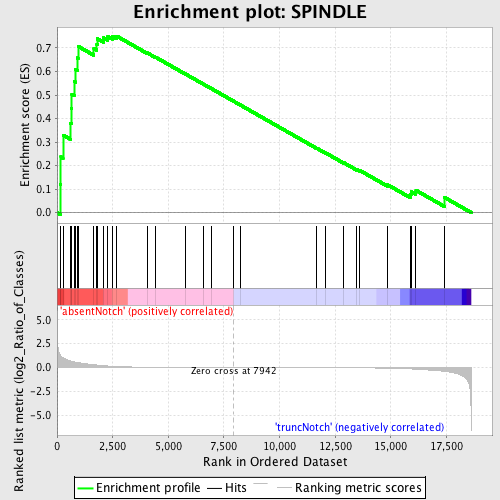
Profile of the Running ES Score & Positions of GeneSet Members on the Rank Ordered List
| Dataset | Set_03_absentNotch_versus_truncNotch.phenotype_absentNotch_versus_truncNotch.cls #absentNotch_versus_truncNotch.phenotype_absentNotch_versus_truncNotch.cls #absentNotch_versus_truncNotch_repos |
| Phenotype | phenotype_absentNotch_versus_truncNotch.cls#absentNotch_versus_truncNotch_repos |
| Upregulated in class | absentNotch |
| GeneSet | SPINDLE |
| Enrichment Score (ES) | 0.7503669 |
| Normalized Enrichment Score (NES) | 1.5424739 |
| Nominal p-value | 0.010526316 |
| FDR q-value | 0.31380573 |
| FWER p-Value | 0.986 |
| PROBE | DESCRIPTION (from dataset) | GENE SYMBOL | GENE_TITLE | RANK IN GENE LIST | RANK METRIC SCORE | RUNNING ES | CORE ENRICHMENT | |
|---|---|---|---|---|---|---|---|---|
| 1 | ZW10 | 2900735 3520687 | 144 | 1.315 | 0.1204 | Yes | ||
| 2 | PRC1 | 870092 5890204 | 171 | 1.210 | 0.2369 | Yes | ||
| 3 | MAPRE1 | 3290037 | 267 | 1.005 | 0.3297 | Yes | ||
| 4 | POLB | 1400333 | 595 | 0.694 | 0.3797 | Yes | ||
| 5 | ARL8A | 4810162 | 644 | 0.662 | 0.4417 | Yes | ||
| 6 | TPX2 | 6420324 | 664 | 0.653 | 0.5043 | Yes | ||
| 7 | ARL8B | 3710368 | 768 | 0.602 | 0.5574 | Yes | ||
| 8 | NEDD9 | 1740373 4230053 | 829 | 0.570 | 0.6098 | Yes | ||
| 9 | KIF23 | 5570112 | 915 | 0.539 | 0.6578 | Yes | ||
| 10 | KIF4A | 1410465 4760070 | 947 | 0.520 | 0.7068 | Yes | ||
| 11 | CDC16 | 1940706 | 1654 | 0.291 | 0.6971 | Yes | ||
| 12 | AURKA | 780537 | 1786 | 0.261 | 0.7155 | Yes | ||
| 13 | NDE1 | 1580242 3830097 | 1813 | 0.254 | 0.7389 | Yes | ||
| 14 | KNTC1 | 430079 | 2080 | 0.195 | 0.7436 | Yes | ||
| 15 | DLG7 | 3120041 | 2280 | 0.160 | 0.7484 | Yes | ||
| 16 | CLASP1 | 6860279 | 2482 | 0.130 | 0.7503 | Yes | ||
| 17 | TUBG1 | 3140204 | 2678 | 0.109 | 0.7504 | Yes | ||
| 18 | INCENP | 520593 | 4053 | 0.027 | 0.6791 | No | ||
| 19 | LATS2 | 4480593 6020494 | 4435 | 0.019 | 0.6604 | No | ||
| 20 | TTK | 3800129 | 5757 | 0.007 | 0.5900 | No | ||
| 21 | CENPF | 5050088 | 6573 | 0.004 | 0.5465 | No | ||
| 22 | CLASP2 | 2510139 | 6953 | 0.003 | 0.5263 | No | ||
| 23 | KIF11 | 5390139 | 7948 | -0.000 | 0.4728 | No | ||
| 24 | FBXO5 | 2630551 | 8233 | -0.001 | 0.4576 | No | ||
| 25 | CETN1 | 6020056 | 11670 | -0.012 | 0.2739 | No | ||
| 26 | KATNA1 | 6290048 | 12082 | -0.015 | 0.2532 | No | ||
| 27 | TUBGCP3 | 4920563 | 12884 | -0.022 | 0.2122 | No | ||
| 28 | BUB1 | 5390270 | 13478 | -0.029 | 0.1831 | No | ||
| 29 | PAFAH1B1 | 4230333 6420121 6450066 | 13599 | -0.032 | 0.1798 | No | ||
| 30 | SMC3 | 870546 1400411 5700039 6450577 | 14859 | -0.065 | 0.1183 | No | ||
| 31 | BIRC5 | 110408 580014 1770632 | 15889 | -0.142 | 0.0768 | No | ||
| 32 | NUMA1 | 6520576 | 15913 | -0.145 | 0.0896 | No | ||
| 33 | DCTN1 | 1450056 6590022 | 16129 | -0.174 | 0.0950 | No | ||
| 34 | CDC20 | 3440017 3440044 6220088 | 17407 | -0.398 | 0.0651 | No |

