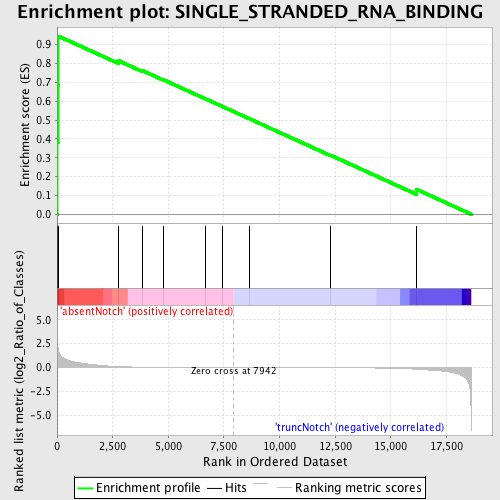
Profile of the Running ES Score & Positions of GeneSet Members on the Rank Ordered List
| Dataset | Set_03_absentNotch_versus_truncNotch.phenotype_absentNotch_versus_truncNotch.cls #absentNotch_versus_truncNotch.phenotype_absentNotch_versus_truncNotch.cls #absentNotch_versus_truncNotch_repos |
| Phenotype | phenotype_absentNotch_versus_truncNotch.cls#absentNotch_versus_truncNotch_repos |
| Upregulated in class | absentNotch |
| GeneSet | SINGLE_STRANDED_RNA_BINDING |
| Enrichment Score (ES) | 0.94478786 |
| Normalized Enrichment Score (NES) | 1.6301987 |
| Nominal p-value | 0.0019646366 |
| FDR q-value | 0.1501875 |
| FWER p-Value | 0.559 |
| PROBE | DESCRIPTION (from dataset) | GENE SYMBOL | GENE_TITLE | RANK IN GENE LIST | RANK METRIC SCORE | RUNNING ES | CORE ENRICHMENT | |
|---|---|---|---|---|---|---|---|---|
| 1 | HNRPH1 | 1170086 3140546 3290471 6110184 6110373 | 17 | 2.557 | 0.3826 | Yes | ||
| 2 | HNRPDL | 1050102 1090181 5360471 | 44 | 2.002 | 0.6815 | Yes | ||
| 3 | PABPC1 | 2650180 2690253 6020632 1990270 | 58 | 1.760 | 0.9448 | Yes | ||
| 4 | PABPC4 | 1990170 6760270 5390138 | 2773 | 0.099 | 0.8138 | No | ||
| 5 | EIF4A3 | 3440538 | 3816 | 0.035 | 0.7630 | No | ||
| 6 | TLR7 | 3140300 | 4795 | 0.014 | 0.7125 | No | ||
| 7 | TIA1 | 4670373 | 6649 | 0.004 | 0.6135 | No | ||
| 8 | TLR8 | 1240092 | 7436 | 0.001 | 0.5714 | No | ||
| 9 | ADARB2 | 2190170 | 8630 | -0.002 | 0.5076 | No | ||
| 10 | ATXN1 | 5550156 | 12306 | -0.016 | 0.3125 | No | ||
| 11 | ZFP36 | 2030605 | 16142 | -0.177 | 0.1330 | No |

