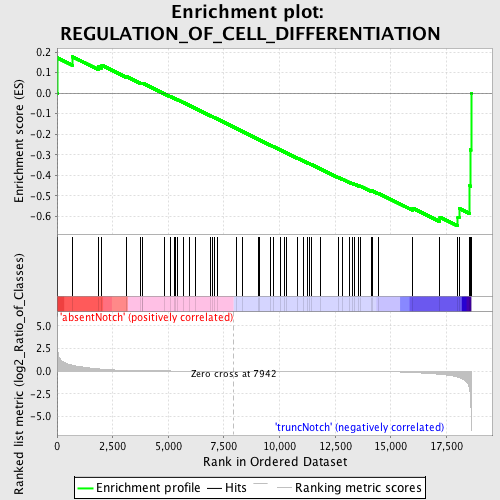
Profile of the Running ES Score & Positions of GeneSet Members on the Rank Ordered List
| Dataset | Set_03_absentNotch_versus_truncNotch.phenotype_absentNotch_versus_truncNotch.cls #absentNotch_versus_truncNotch.phenotype_absentNotch_versus_truncNotch.cls #absentNotch_versus_truncNotch_repos |
| Phenotype | phenotype_absentNotch_versus_truncNotch.cls#absentNotch_versus_truncNotch_repos |
| Upregulated in class | truncNotch |
| GeneSet | REGULATION_OF_CELL_DIFFERENTIATION |
| Enrichment Score (ES) | -0.6472079 |
| Normalized Enrichment Score (NES) | -1.429821 |
| Nominal p-value | 0.02357564 |
| FDR q-value | 0.96602386 |
| FWER p-Value | 1.0 |
| PROBE | DESCRIPTION (from dataset) | GENE SYMBOL | GENE_TITLE | RANK IN GENE LIST | RANK METRIC SCORE | RUNNING ES | CORE ENRICHMENT | |
|---|---|---|---|---|---|---|---|---|
| 1 | BTG1 | 4200735 6040131 6200133 | 14 | 2.662 | 0.1726 | No | ||
| 2 | RUNX1 | 3840711 | 697 | 0.634 | 0.1772 | No | ||
| 3 | LDB1 | 5270601 | 1854 | 0.244 | 0.1308 | No | ||
| 4 | YWHAG | 3780341 | 2010 | 0.207 | 0.1359 | No | ||
| 5 | ACVR1B | 3610446 5570195 | 3139 | 0.071 | 0.0798 | No | ||
| 6 | YWHAH | 1660133 2810053 | 3745 | 0.038 | 0.0496 | No | ||
| 7 | PPARG | 1990168 2680603 6130632 | 3831 | 0.034 | 0.0473 | No | ||
| 8 | CDK6 | 4920253 | 3844 | 0.034 | 0.0488 | No | ||
| 9 | SPINK5 | 5900010 | 4842 | 0.013 | -0.0040 | No | ||
| 10 | SHH | 5570400 | 5085 | 0.011 | -0.0163 | No | ||
| 11 | IL20 | 4850647 | 5260 | 0.010 | -0.0251 | No | ||
| 12 | CALCA | 5860167 | 5339 | 0.009 | -0.0287 | No | ||
| 13 | NOTCH2 | 2570397 | 5426 | 0.009 | -0.0327 | No | ||
| 14 | IGFBP3 | 2370500 | 5663 | 0.007 | -0.0450 | No | ||
| 15 | SCIN | 5420180 | 5951 | 0.006 | -0.0600 | No | ||
| 16 | TGFB2 | 4920292 | 6205 | 0.005 | -0.0733 | No | ||
| 17 | TBX5 | 2900132 6370484 | 6908 | 0.003 | -0.1110 | No | ||
| 18 | NLGN1 | 5670278 | 6991 | 0.003 | -0.1152 | No | ||
| 19 | SNF1LK | 6110403 | 7066 | 0.002 | -0.1190 | No | ||
| 20 | BMPR1B | 4560010 4760121 6450161 | 7186 | 0.002 | -0.1253 | No | ||
| 21 | IL7 | 5360440 | 8071 | -0.000 | -0.1729 | No | ||
| 22 | NANOG | 2230152 3140114 4730632 | 8323 | -0.001 | -0.1864 | No | ||
| 23 | PF4 | 6130332 | 9052 | -0.003 | -0.2254 | No | ||
| 24 | NF1 | 6980433 | 9083 | -0.003 | -0.2268 | No | ||
| 25 | MAFB | 1230471 | 9611 | -0.004 | -0.2550 | No | ||
| 26 | BOC | 5270348 | 9703 | -0.005 | -0.2596 | No | ||
| 27 | IL27 | 1990324 | 10058 | -0.006 | -0.2783 | No | ||
| 28 | ACVR2A | 6110647 | 10221 | -0.006 | -0.2866 | No | ||
| 29 | BMP4 | 380113 | 10330 | -0.007 | -0.2920 | No | ||
| 30 | CNTN4 | 1780300 5570577 6370019 | 10810 | -0.008 | -0.3172 | No | ||
| 31 | GPR98 | 6400647 | 11095 | -0.009 | -0.3319 | No | ||
| 32 | EREG | 50519 4920129 | 11266 | -0.010 | -0.3404 | No | ||
| 33 | NOTCH4 | 2450040 6370707 | 11342 | -0.010 | -0.3438 | No | ||
| 34 | TCFL5 | 2190019 | 11424 | -0.011 | -0.3475 | No | ||
| 35 | CARTPT | 6660687 | 11822 | -0.013 | -0.3680 | No | ||
| 36 | TBX3 | 2570672 | 12640 | -0.019 | -0.4108 | No | ||
| 37 | SART1 | 5700113 | 12806 | -0.021 | -0.4183 | No | ||
| 38 | ZBTB16 | 3290022 | 13124 | -0.024 | -0.4338 | No | ||
| 39 | IL4 | 6020537 | 13283 | -0.026 | -0.4406 | No | ||
| 40 | FOXO3 | 2510484 4480451 | 13380 | -0.028 | -0.4440 | No | ||
| 41 | INHA | 6100102 | 13546 | -0.031 | -0.4509 | No | ||
| 42 | NME2 | 2190672 | 13654 | -0.033 | -0.4545 | No | ||
| 43 | ETS1 | 5270278 6450717 6620465 | 14113 | -0.042 | -0.4765 | No | ||
| 44 | NPHP3 | 2450497 7050731 | 14162 | -0.043 | -0.4762 | No | ||
| 45 | SOCS5 | 3830398 7100093 | 14428 | -0.050 | -0.4872 | No | ||
| 46 | SPI1 | 1410397 | 15991 | -0.158 | -0.5611 | No | ||
| 47 | MAP4K1 | 4060692 | 17206 | -0.350 | -0.6037 | No | ||
| 48 | TWIST2 | 6760433 | 18015 | -0.652 | -0.6048 | Yes | ||
| 49 | ACIN1 | 3390278 6350377 6620142 | 18072 | -0.702 | -0.5621 | Yes | ||
| 50 | NOTCH1 | 3390114 | 18550 | -2.087 | -0.4519 | Yes | ||
| 51 | ZAP70 | 1410494 2260504 | 18586 | -2.724 | -0.2764 | Yes | ||
| 52 | DTX1 | 5900372 | 18604 | -4.268 | 0.0006 | Yes |

