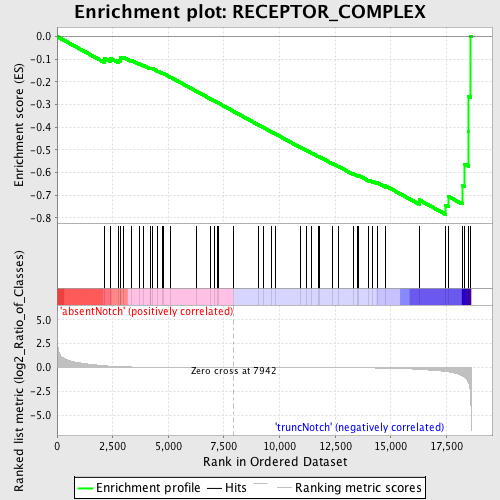
Profile of the Running ES Score & Positions of GeneSet Members on the Rank Ordered List
| Dataset | Set_03_absentNotch_versus_truncNotch.phenotype_absentNotch_versus_truncNotch.cls #absentNotch_versus_truncNotch.phenotype_absentNotch_versus_truncNotch.cls #absentNotch_versus_truncNotch_repos |
| Phenotype | phenotype_absentNotch_versus_truncNotch.cls#absentNotch_versus_truncNotch_repos |
| Upregulated in class | truncNotch |
| GeneSet | RECEPTOR_COMPLEX |
| Enrichment Score (ES) | -0.78557426 |
| Normalized Enrichment Score (NES) | -1.7032473 |
| Nominal p-value | 0.0 |
| FDR q-value | 0.114498265 |
| FWER p-Value | 0.119 |
| PROBE | DESCRIPTION (from dataset) | GENE SYMBOL | GENE_TITLE | RANK IN GENE LIST | RANK METRIC SCORE | RUNNING ES | CORE ENRICHMENT | |
|---|---|---|---|---|---|---|---|---|
| 1 | IL6R | 520706 3800215 | 2135 | 0.185 | -0.0967 | No | ||
| 2 | CD247 | 3800725 5720136 | 2391 | 0.144 | -0.0962 | No | ||
| 3 | ITGA3 | 4570427 | 2749 | 0.102 | -0.1054 | No | ||
| 4 | ITGA10 | 6330438 | 2841 | 0.094 | -0.1010 | No | ||
| 5 | SRP9 | 3170053 4540538 | 2859 | 0.092 | -0.0928 | No | ||
| 6 | SRPR | 6590647 6370114 | 2977 | 0.082 | -0.0910 | No | ||
| 7 | BCL10 | 2360397 | 3328 | 0.059 | -0.1041 | No | ||
| 8 | OSMR | 1990519 | 3681 | 0.040 | -0.1191 | No | ||
| 9 | IL13RA1 | 5550609 | 3898 | 0.032 | -0.1275 | No | ||
| 10 | TRIP6 | 6520609 | 4191 | 0.023 | -0.1409 | No | ||
| 11 | GRIN1 | 3800014 7000609 | 4218 | 0.023 | -0.1401 | No | ||
| 12 | ITGAM | 1190373 | 4270 | 0.022 | -0.1407 | No | ||
| 13 | ACVR1 | 6840671 | 4525 | 0.017 | -0.1527 | No | ||
| 14 | ITGA5 | 5550520 | 4722 | 0.015 | -0.1618 | No | ||
| 15 | ITGB6 | 2810068 4570332 | 4770 | 0.014 | -0.1630 | No | ||
| 16 | CHRNA6 | 5340092 | 5117 | 0.011 | -0.1805 | No | ||
| 17 | CHRND | 840403 2260670 | 6264 | 0.005 | -0.2418 | No | ||
| 18 | SYK | 6940133 | 6910 | 0.003 | -0.2762 | No | ||
| 19 | CHRNA1 | 1170025 3610364 5220292 | 7069 | 0.002 | -0.2845 | No | ||
| 20 | BMPR1B | 4560010 4760121 6450161 | 7186 | 0.002 | -0.2906 | No | ||
| 21 | ACVR1C | 5890044 | 7251 | 0.002 | -0.2938 | No | ||
| 22 | CHRNA4 | 730075 2680091 | 7913 | 0.000 | -0.3294 | No | ||
| 23 | SDCBP | 460487 2190039 5270441 | 9036 | -0.003 | -0.3896 | No | ||
| 24 | TGFBR1 | 1400148 4280020 6550711 | 9263 | -0.003 | -0.4014 | No | ||
| 25 | ITGA11 | 1740112 6590110 | 9626 | -0.004 | -0.4205 | No | ||
| 26 | ITGA8 | 4050086 | 9824 | -0.005 | -0.4306 | No | ||
| 27 | ITGAE | 4210632 4670239 5340253 5420746 5690154 5700685 6770154 | 10920 | -0.009 | -0.4887 | No | ||
| 28 | ITGAX | 6130524 | 11224 | -0.010 | -0.5041 | No | ||
| 29 | CHRNB2 | 580204 3120739 | 11453 | -0.011 | -0.5153 | No | ||
| 30 | ADRB3 | 6900072 | 11728 | -0.012 | -0.5288 | No | ||
| 31 | CHRNA3 | 6760100 | 11795 | -0.013 | -0.5311 | No | ||
| 32 | IL28RA | 3710072 4920242 | 12389 | -0.017 | -0.5614 | No | ||
| 33 | CHRNB3 | 430441 870725 5720204 | 12657 | -0.019 | -0.5739 | No | ||
| 34 | CHRNA7 | 2970446 | 13311 | -0.027 | -0.6064 | No | ||
| 35 | CHRNA2 | 5050315 | 13523 | -0.030 | -0.6148 | No | ||
| 36 | CD79A | 3450563 | 13555 | -0.031 | -0.6134 | No | ||
| 37 | ITGB4 | 1740021 3840482 | 14014 | -0.039 | -0.6342 | No | ||
| 38 | ITGB3 | 5270463 | 14194 | -0.044 | -0.6394 | No | ||
| 39 | CHRNE | 3190170 | 14380 | -0.049 | -0.6446 | No | ||
| 40 | CHRNB4 | 6370110 | 14772 | -0.062 | -0.6595 | No | ||
| 41 | ITGA9 | 670180 | 16273 | -0.194 | -0.7211 | No | ||
| 42 | CARD11 | 70338 | 17471 | -0.416 | -0.7444 | Yes | ||
| 43 | SMAD3 | 6450671 | 17586 | -0.454 | -0.7057 | Yes | ||
| 44 | ADRB2 | 3290373 | 18208 | -0.843 | -0.6559 | Yes | ||
| 45 | ITGB7 | 4670619 | 18319 | -0.998 | -0.5632 | Yes | ||
| 46 | MYH9 | 3120091 4850292 | 18491 | -1.558 | -0.4184 | Yes | ||
| 47 | TGFBR2 | 1780711 1980537 6550398 | 18499 | -1.576 | -0.2630 | Yes | ||
| 48 | ZAP70 | 1410494 2260504 | 18586 | -2.724 | 0.0016 | Yes |

