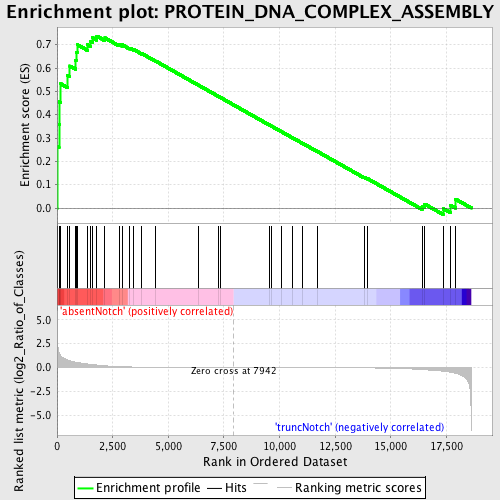
Profile of the Running ES Score & Positions of GeneSet Members on the Rank Ordered List
| Dataset | Set_03_absentNotch_versus_truncNotch.phenotype_absentNotch_versus_truncNotch.cls #absentNotch_versus_truncNotch.phenotype_absentNotch_versus_truncNotch.cls #absentNotch_versus_truncNotch_repos |
| Phenotype | phenotype_absentNotch_versus_truncNotch.cls#absentNotch_versus_truncNotch_repos |
| Upregulated in class | absentNotch |
| GeneSet | PROTEIN_DNA_COMPLEX_ASSEMBLY |
| Enrichment Score (ES) | 0.73667186 |
| Normalized Enrichment Score (NES) | 1.5496492 |
| Nominal p-value | 0.0064655175 |
| FDR q-value | 0.29802772 |
| FWER p-Value | 0.977 |
| PROBE | DESCRIPTION (from dataset) | GENE SYMBOL | GENE_TITLE | RANK IN GENE LIST | RANK METRIC SCORE | RUNNING ES | CORE ENRICHMENT | |
|---|---|---|---|---|---|---|---|---|
| 1 | GTF2I | 2470750 3870408 3830369 3990082 4610138 | 2 | 4.021 | 0.2632 | Yes | ||
| 2 | ATF7IP | 2690176 6770021 | 87 | 1.539 | 0.3594 | Yes | ||
| 3 | HMGB1 | 2120670 2350044 | 98 | 1.471 | 0.4552 | Yes | ||
| 4 | BRF1 | 2100047 | 166 | 1.230 | 0.5321 | Yes | ||
| 5 | GTF2E1 | 4070014 | 464 | 0.796 | 0.5683 | Yes | ||
| 6 | TBP | 1450601 2810193 | 575 | 0.707 | 0.6086 | Yes | ||
| 7 | NAP1L4 | 1240504 | 834 | 0.569 | 0.6320 | Yes | ||
| 8 | E2F2 | 5270609 5570377 7000465 | 857 | 0.559 | 0.6674 | Yes | ||
| 9 | MED12 | 4920095 | 903 | 0.542 | 0.7004 | Yes | ||
| 10 | CHAF1B | 3940142 | 1364 | 0.371 | 0.7000 | Yes | ||
| 11 | GTF2E2 | 4010441 | 1512 | 0.333 | 0.7139 | Yes | ||
| 12 | RSF1 | 1580097 | 1591 | 0.309 | 0.7299 | Yes | ||
| 13 | GTF3C4 | 1940750 4730114 | 1784 | 0.261 | 0.7367 | Yes | ||
| 14 | MED4 | 4480050 | 2150 | 0.182 | 0.7289 | No | ||
| 15 | ASF1A | 7050020 | 2791 | 0.098 | 0.7009 | No | ||
| 16 | SNAPC5 | 1580215 | 2927 | 0.086 | 0.6993 | No | ||
| 17 | GTF2F1 | 360093 | 3260 | 0.063 | 0.6855 | No | ||
| 18 | E2F3 | 50162 460180 | 3439 | 0.052 | 0.6794 | No | ||
| 19 | CHAF1A | 6040647 | 3811 | 0.035 | 0.6617 | No | ||
| 20 | PPARGC1A | 4670040 | 4434 | 0.019 | 0.6295 | No | ||
| 21 | SET | 6650286 | 6370 | 0.004 | 0.5256 | No | ||
| 22 | PBX1 | 6660301 | 7250 | 0.002 | 0.4784 | No | ||
| 23 | NAP1L3 | 6020079 | 7325 | 0.002 | 0.4745 | No | ||
| 24 | NCOA6 | 1780333 6450110 | 9535 | -0.004 | 0.3559 | No | ||
| 25 | SMARCA5 | 6620050 | 9652 | -0.004 | 0.3500 | No | ||
| 26 | PTRF | 2260204 | 10083 | -0.006 | 0.3272 | No | ||
| 27 | NAP1L2 | 130047 | 10594 | -0.007 | 0.3003 | No | ||
| 28 | CDK7 | 2640451 | 11027 | -0.009 | 0.2776 | No | ||
| 29 | THRAP3 | 6180309 | 11717 | -0.012 | 0.2413 | No | ||
| 30 | PBX3 | 1300424 3710577 6180575 | 13801 | -0.035 | 0.1315 | No | ||
| 31 | TAF5 | 3450288 5890193 6860435 | 13941 | -0.038 | 0.1265 | No | ||
| 32 | GTF2F2 | 2690546 | 16408 | -0.216 | 0.0079 | No | ||
| 33 | CDK9 | 630707 | 16522 | -0.231 | 0.0169 | No | ||
| 34 | PBX4 | 6370086 | 17353 | -0.384 | -0.0026 | No | ||
| 35 | NAP1L1 | 2510593 5900215 5090470 450079 4920280 | 17691 | -0.487 | 0.0111 | No | ||
| 36 | MAZ | 3360121 6940750 | 17904 | -0.590 | 0.0383 | No |

