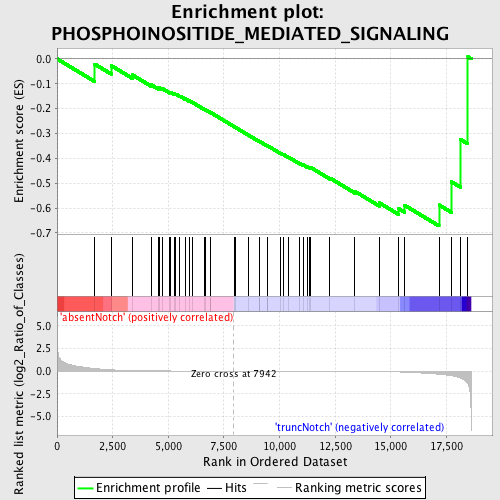
Profile of the Running ES Score & Positions of GeneSet Members on the Rank Ordered List
| Dataset | Set_03_absentNotch_versus_truncNotch.phenotype_absentNotch_versus_truncNotch.cls #absentNotch_versus_truncNotch.phenotype_absentNotch_versus_truncNotch.cls #absentNotch_versus_truncNotch_repos |
| Phenotype | phenotype_absentNotch_versus_truncNotch.cls#absentNotch_versus_truncNotch_repos |
| Upregulated in class | truncNotch |
| GeneSet | PHOSPHOINOSITIDE_MEDIATED_SIGNALING |
| Enrichment Score (ES) | -0.67183554 |
| Normalized Enrichment Score (NES) | -1.4373076 |
| Nominal p-value | 0.02819549 |
| FDR q-value | 1.0 |
| FWER p-Value | 1.0 |
| PROBE | DESCRIPTION (from dataset) | GENE SYMBOL | GENE_TITLE | RANK IN GENE LIST | RANK METRIC SCORE | RUNNING ES | CORE ENRICHMENT | |
|---|---|---|---|---|---|---|---|---|
| 1 | LTB4R | 1770056 | 1690 | 0.282 | -0.0210 | No | ||
| 2 | P2RY6 | 5290400 | 2435 | 0.137 | -0.0272 | No | ||
| 3 | NMUR2 | 1580717 | 3382 | 0.056 | -0.0644 | No | ||
| 4 | IL8RB | 450592 1170537 | 4225 | 0.023 | -0.1041 | No | ||
| 5 | GNA15 | 870037 | 4553 | 0.017 | -0.1175 | No | ||
| 6 | NMUR1 | 1500403 | 4610 | 0.016 | -0.1166 | No | ||
| 7 | DRD2 | 5890369 | 4750 | 0.014 | -0.1205 | No | ||
| 8 | CCKAR | 4210079 | 5064 | 0.011 | -0.1346 | No | ||
| 9 | DRD1 | 430025 | 5090 | 0.011 | -0.1333 | No | ||
| 10 | GAP43 | 3130504 | 5276 | 0.010 | -0.1408 | No | ||
| 11 | CALCA | 5860167 | 5339 | 0.009 | -0.1419 | No | ||
| 12 | PLCB2 | 360132 | 5520 | 0.008 | -0.1496 | No | ||
| 13 | PARD3 | 3390324 5390541 | 5758 | 0.007 | -0.1606 | No | ||
| 14 | C5AR1 | 4540402 | 5928 | 0.006 | -0.1681 | No | ||
| 15 | EDG2 | 6290215 | 6071 | 0.006 | -0.1744 | No | ||
| 16 | PLCE1 | 4780685 | 6611 | 0.004 | -0.2025 | No | ||
| 17 | TACR1 | 70358 3840411 | 6667 | 0.004 | -0.2046 | No | ||
| 18 | GRM5 | 60528 | 6911 | 0.003 | -0.2170 | No | ||
| 19 | EDN2 | 6760647 | 6916 | 0.003 | -0.2165 | No | ||
| 20 | HOMER1 | 360131 1690092 1990300 4590068 | 7976 | -0.000 | -0.2735 | No | ||
| 21 | AVPR1B | 1190707 | 8029 | -0.000 | -0.2763 | No | ||
| 22 | NMBR | 6180315 | 8601 | -0.002 | -0.3066 | No | ||
| 23 | AVPR1A | 2120300 | 9113 | -0.003 | -0.3334 | No | ||
| 24 | EDNRB | 4280717 6400435 | 9114 | -0.003 | -0.3327 | No | ||
| 25 | CHRM2 | 870750 | 9448 | -0.004 | -0.3497 | No | ||
| 26 | HTR2B | 6510538 | 9460 | -0.004 | -0.3493 | No | ||
| 27 | MC3R | 3290538 | 10051 | -0.006 | -0.3796 | No | ||
| 28 | CHRM1 | 4280619 | 10158 | -0.006 | -0.3839 | No | ||
| 29 | P2RY4 | 630053 | 10402 | -0.007 | -0.3953 | No | ||
| 30 | CCKBR | 2760128 | 10913 | -0.009 | -0.4206 | No | ||
| 31 | HRH1 | 840100 | 11060 | -0.009 | -0.4262 | No | ||
| 32 | PRKD3 | 5220520 5890519 | 11241 | -0.010 | -0.4334 | No | ||
| 33 | AGTR1 | 4780524 2680592 | 11345 | -0.010 | -0.4364 | No | ||
| 34 | GNAQ | 430670 4210131 5900736 | 11405 | -0.011 | -0.4369 | No | ||
| 35 | P2RY1 | 6040121 | 12265 | -0.016 | -0.4792 | No | ||
| 36 | P2RY2 | 2640180 2810128 | 13388 | -0.028 | -0.5328 | No | ||
| 37 | EGFR | 4920138 6480521 | 14489 | -0.052 | -0.5791 | No | ||
| 38 | PPAP2A | 1170397 3440288 3930270 | 15357 | -0.092 | -0.6028 | Yes | ||
| 39 | EDNRA | 6900133 | 15620 | -0.114 | -0.5886 | Yes | ||
| 40 | F2RL3 | 5340010 | 17167 | -0.341 | -0.5873 | Yes | ||
| 41 | EDG4 | 1770097 1780519 | 17720 | -0.497 | -0.4939 | Yes | ||
| 42 | EDG6 | 2630121 | 18136 | -0.774 | -0.3242 | Yes | ||
| 43 | PICK1 | 3990500 4920500 | 18465 | -1.411 | 0.0081 | Yes |

