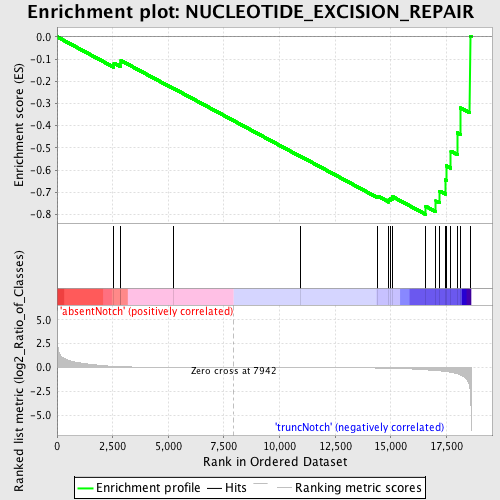
Profile of the Running ES Score & Positions of GeneSet Members on the Rank Ordered List
| Dataset | Set_03_absentNotch_versus_truncNotch.phenotype_absentNotch_versus_truncNotch.cls #absentNotch_versus_truncNotch.phenotype_absentNotch_versus_truncNotch.cls #absentNotch_versus_truncNotch_repos |
| Phenotype | phenotype_absentNotch_versus_truncNotch.cls#absentNotch_versus_truncNotch_repos |
| Upregulated in class | truncNotch |
| GeneSet | NUCLEOTIDE_EXCISION_REPAIR |
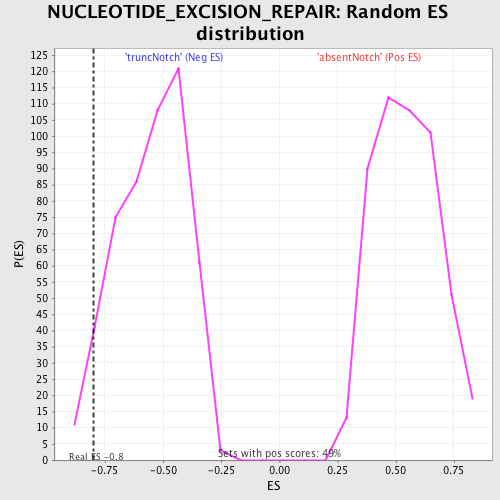
| Enrichment Score (ES) | -0.79955375 |
| Normalized Enrichment Score (NES) | -1.461799 |
| Nominal p-value | 0.041501977 |
| FDR q-value | 1.0 |
| FWER p-Value | 1.0 |
| PROBE | DESCRIPTION (from dataset) | GENE SYMBOL | GENE_TITLE | RANK IN GENE LIST | RANK METRIC SCORE | RUNNING ES | CORE ENRICHMENT | |
|---|---|---|---|---|---|---|---|---|
| 1 | BRCA2 | 4280372 | 2554 | 0.122 | -0.1184 | No | ||
| 2 | LIG4 | 6660035 | 2862 | 0.092 | -0.1206 | No | ||
| 3 | ATXN3 | 50156 2900095 | 2868 | 0.092 | -0.1067 | No | ||
| 4 | RAD23B | 2190671 | 5251 | 0.010 | -0.2333 | No | ||
| 5 | RAD23A | 670082 5270309 5360463 5550364 | 10959 | -0.009 | -0.5388 | No | ||
| 6 | ERCC5 | 770025 4540692 | 14420 | -0.050 | -0.7170 | No | ||
| 7 | ERCC3 | 6900008 | 14917 | -0.068 | -0.7332 | No | ||
| 8 | DDB2 | 3520341 4610168 4850184 4920717 | 14975 | -0.070 | -0.7254 | No | ||
| 9 | XPC | 6370193 | 15067 | -0.075 | -0.7186 | No | ||
| 10 | NTHL1 | 4920148 | 16573 | -0.237 | -0.7629 | Yes | ||
| 11 | ERCC8 | 1240300 6450372 6590180 | 17026 | -0.314 | -0.7387 | Yes | ||
| 12 | ERCC4 | 1570619 5720180 | 17198 | -0.348 | -0.6939 | Yes | ||
| 13 | DDB1 | 6110687 | 17459 | -0.413 | -0.6439 | Yes | ||
| 14 | XAB2 | 60110 | 17499 | -0.424 | -0.5803 | Yes | ||
| 15 | TP53 | 6130707 | 17702 | -0.490 | -0.5153 | Yes | ||
| 16 | ERCC2 | 2360750 4060390 6550138 | 17996 | -0.639 | -0.4321 | Yes | ||
| 17 | ERCC1 | 3800010 4590132 4670397 | 18133 | -0.771 | -0.3200 | Yes | ||
| 18 | POLL | 5910673 6350672 | 18558 | -2.234 | 0.0031 | Yes |