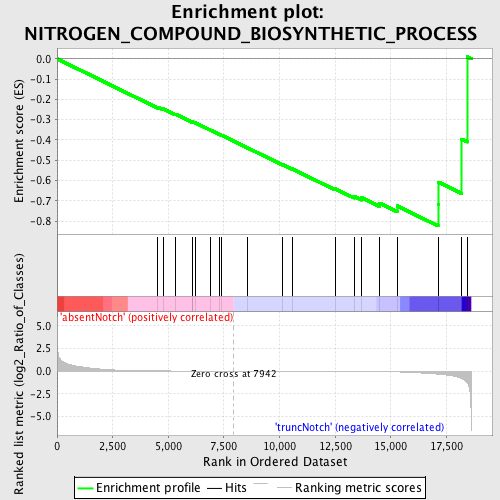
Profile of the Running ES Score & Positions of GeneSet Members on the Rank Ordered List
| Dataset | Set_03_absentNotch_versus_truncNotch.phenotype_absentNotch_versus_truncNotch.cls #absentNotch_versus_truncNotch.phenotype_absentNotch_versus_truncNotch.cls #absentNotch_versus_truncNotch_repos |
| Phenotype | phenotype_absentNotch_versus_truncNotch.cls#absentNotch_versus_truncNotch_repos |
| Upregulated in class | truncNotch |
| GeneSet | NITROGEN_COMPOUND_BIOSYNTHETIC_PROCESS |
| Enrichment Score (ES) | -0.823807 |
| Normalized Enrichment Score (NES) | -1.5432693 |
| Nominal p-value | 0.00998004 |
| FDR q-value | 0.82186836 |
| FWER p-Value | 0.993 |
| PROBE | DESCRIPTION (from dataset) | GENE SYMBOL | GENE_TITLE | RANK IN GENE LIST | RANK METRIC SCORE | RUNNING ES | CORE ENRICHMENT | |
|---|---|---|---|---|---|---|---|---|
| 1 | PRG3 | 6220020 | 4527 | 0.017 | -0.2378 | No | ||
| 2 | HSP90AB1 | 3170358 5390102 6040093 | 4782 | 0.014 | -0.2470 | No | ||
| 3 | MAT2B | 1690139 2510706 | 5309 | 0.009 | -0.2722 | No | ||
| 4 | PLOD1 | 6040427 | 6079 | 0.006 | -0.3118 | No | ||
| 5 | GLA | 4610364 | 6084 | 0.006 | -0.3102 | No | ||
| 6 | TGFB2 | 4920292 | 6205 | 0.005 | -0.3150 | No | ||
| 7 | SLC5A7 | 4760091 | 6905 | 0.003 | -0.3517 | No | ||
| 8 | ALDH18A1 | 2340601 | 7279 | 0.002 | -0.3712 | No | ||
| 9 | AKT1 | 5290746 | 7384 | 0.001 | -0.3763 | No | ||
| 10 | CDO1 | 2480279 | 8579 | -0.002 | -0.4400 | No | ||
| 11 | BBOX1 | 2030538 2370452 | 10136 | -0.006 | -0.5217 | No | ||
| 12 | PAH | 3800309 | 10568 | -0.007 | -0.5425 | No | ||
| 13 | DDAH2 | 4480551 | 12496 | -0.018 | -0.6403 | No | ||
| 14 | HSP90AA1 | 4560041 5220133 2120722 | 13348 | -0.027 | -0.6773 | No | ||
| 15 | NQO1 | 3450136 6840121 | 13696 | -0.034 | -0.6850 | No | ||
| 16 | EGFR | 4920138 6480521 | 14489 | -0.052 | -0.7106 | No | ||
| 17 | PYCR1 | 6180670 | 15283 | -0.088 | -0.7248 | Yes | ||
| 18 | OAZ1 | 110181 | 17125 | -0.331 | -0.7162 | Yes | ||
| 19 | SPR | 6840170 | 17144 | -0.335 | -0.6080 | Yes | ||
| 20 | GCH1 | 670364 6550358 | 18185 | -0.822 | -0.3964 | Yes | ||
| 21 | BCAT1 | 3290128 4050408 | 18439 | -1.289 | 0.0095 | Yes |

