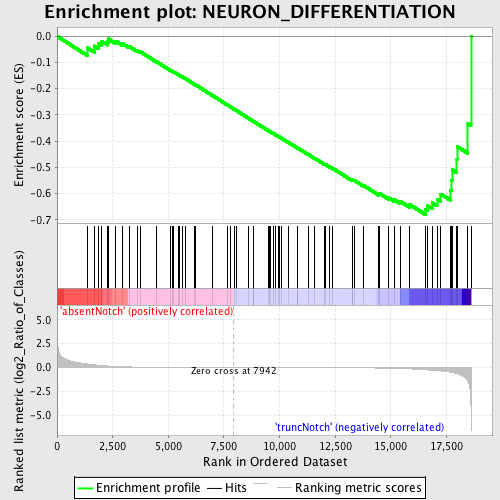
Profile of the Running ES Score & Positions of GeneSet Members on the Rank Ordered List
| Dataset | Set_03_absentNotch_versus_truncNotch.phenotype_absentNotch_versus_truncNotch.cls #absentNotch_versus_truncNotch.phenotype_absentNotch_versus_truncNotch.cls #absentNotch_versus_truncNotch_repos |
| Phenotype | phenotype_absentNotch_versus_truncNotch.cls#absentNotch_versus_truncNotch_repos |
| Upregulated in class | truncNotch |
| GeneSet | NEURON_DIFFERENTIATION |
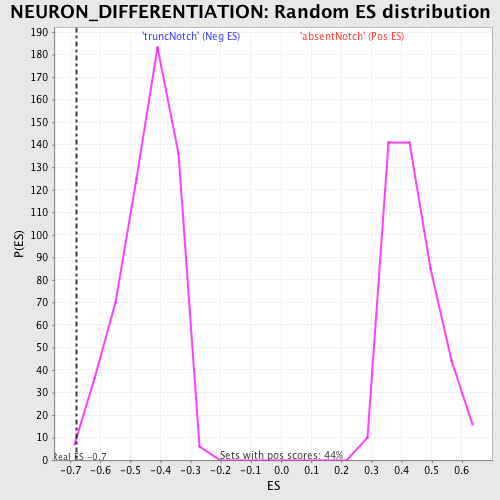
| Enrichment Score (ES) | -0.67974746 |
| Normalized Enrichment Score (NES) | -1.5423332 |
| Nominal p-value | 0.005328597 |
| FDR q-value | 0.6964611 |
| FWER p-Value | 0.995 |
| PROBE | DESCRIPTION (from dataset) | GENE SYMBOL | GENE_TITLE | RANK IN GENE LIST | RANK METRIC SCORE | RUNNING ES | CORE ENRICHMENT | |
|---|---|---|---|---|---|---|---|---|
| 1 | CYFIP1 | 5690082 | 1370 | 0.370 | -0.0443 | No | ||
| 2 | APOE | 4200671 | 1666 | 0.289 | -0.0370 | No | ||
| 3 | LDB1 | 5270601 | 1854 | 0.244 | -0.0275 | No | ||
| 4 | YWHAG | 3780341 | 2010 | 0.207 | -0.0193 | No | ||
| 5 | CDK5R1 | 3870161 | 2270 | 0.161 | -0.0204 | No | ||
| 6 | NRTN | 2450551 | 2308 | 0.155 | -0.0100 | No | ||
| 7 | MAPT | 360706 1230706 | 2634 | 0.115 | -0.0183 | No | ||
| 8 | AMIGO1 | 6180215 | 2926 | 0.086 | -0.0270 | No | ||
| 9 | THY1 | 5910162 | 3234 | 0.064 | -0.0384 | No | ||
| 10 | KLK8 | 60035 2340440 | 3593 | 0.044 | -0.0542 | No | ||
| 11 | YWHAH | 1660133 2810053 | 3745 | 0.038 | -0.0593 | No | ||
| 12 | RTN1 | 4150452 4850176 | 4478 | 0.018 | -0.0973 | No | ||
| 13 | SHH | 5570400 | 5085 | 0.011 | -0.1291 | No | ||
| 14 | SMARCA1 | 4230315 | 5194 | 0.010 | -0.1341 | No | ||
| 15 | BAIAP2 | 460347 4730600 | 5253 | 0.010 | -0.1365 | No | ||
| 16 | OPHN1 | 2360100 | 5454 | 0.008 | -0.1466 | No | ||
| 17 | KCNIP2 | 60088 1780324 | 5497 | 0.008 | -0.1482 | No | ||
| 18 | UBB | 4810138 | 5647 | 0.008 | -0.1556 | No | ||
| 19 | PARD3 | 3390324 5390541 | 5758 | 0.007 | -0.1610 | No | ||
| 20 | FARP2 | 4670037 | 6172 | 0.005 | -0.1829 | No | ||
| 21 | TGFB2 | 4920292 | 6205 | 0.005 | -0.1842 | No | ||
| 22 | NLGN1 | 5670278 | 6991 | 0.003 | -0.2263 | No | ||
| 23 | ROBO1 | 3710398 | 7658 | 0.001 | -0.2621 | No | ||
| 24 | NRXN1 | 460408 5340270 6370066 | 7774 | 0.000 | -0.2683 | No | ||
| 25 | SLIT2 | 1940037 | 7987 | -0.000 | -0.2797 | No | ||
| 26 | FEZ1 | 2630725 4810324 | 8059 | -0.000 | -0.2835 | No | ||
| 27 | UNC5C | 2640056 | 8598 | -0.002 | -0.3124 | No | ||
| 28 | ATP2B2 | 3780397 | 8810 | -0.002 | -0.3236 | No | ||
| 29 | PARD6B | 4120600 | 8843 | -0.002 | -0.3252 | No | ||
| 30 | BTG4 | 4060020 | 9485 | -0.004 | -0.3594 | No | ||
| 31 | GHRL | 2360619 6760438 | 9531 | -0.004 | -0.3615 | No | ||
| 32 | NRXN3 | 1400546 3360471 | 9610 | -0.004 | -0.3654 | No | ||
| 33 | LMX1B | 1260561 | 9744 | -0.005 | -0.3722 | No | ||
| 34 | ROBO2 | 450136 | 9829 | -0.005 | -0.3763 | No | ||
| 35 | NTNG1 | 50270 1410427 4810333 | 9966 | -0.005 | -0.3832 | No | ||
| 36 | S100B | 6520088 | 10009 | -0.006 | -0.3850 | No | ||
| 37 | POU6F2 | 5270451 | 10101 | -0.006 | -0.3894 | No | ||
| 38 | RTN4RL2 | 6450609 | 10387 | -0.007 | -0.4043 | No | ||
| 39 | CNTN4 | 1780300 5570577 6370019 | 10810 | -0.008 | -0.4264 | No | ||
| 40 | PCSK9 | 3120044 | 10812 | -0.008 | -0.4258 | No | ||
| 41 | POU4F1 | 2260315 | 11314 | -0.010 | -0.4519 | No | ||
| 42 | NRP2 | 4070400 5860041 6650446 | 11583 | -0.012 | -0.4655 | No | ||
| 43 | GDNF | 4050487 5720739 | 12012 | -0.014 | -0.4874 | No | ||
| 44 | BAI1 | 6350053 | 12041 | -0.014 | -0.4878 | No | ||
| 45 | SEMA3B | 5570563 | 12259 | -0.016 | -0.4982 | No | ||
| 46 | GLI2 | 3060632 | 12387 | -0.017 | -0.5037 | No | ||
| 47 | CDK5 | 940348 | 13260 | -0.026 | -0.5486 | No | ||
| 48 | MDGA1 | 1170139 | 13286 | -0.026 | -0.5479 | No | ||
| 49 | RND1 | 5080300 | 13357 | -0.027 | -0.5495 | No | ||
| 50 | SLIT1 | 50110 | 13774 | -0.035 | -0.5691 | No | ||
| 51 | ALS2 | 3130546 6400070 | 14467 | -0.051 | -0.6023 | No | ||
| 52 | DPYSL5 | 4900333 | 14480 | -0.052 | -0.5988 | No | ||
| 53 | OTX2 | 1190471 | 14907 | -0.067 | -0.6164 | No | ||
| 54 | BRSK2 | 4050292 | 15142 | -0.079 | -0.6227 | No | ||
| 55 | NTNG2 | 1770438 6380408 | 15445 | -0.099 | -0.6310 | No | ||
| 56 | PAX2 | 6040270 7000133 | 15831 | -0.135 | -0.6410 | No | ||
| 57 | SEMA4F | 3850056 | 16551 | -0.234 | -0.6610 | Yes | ||
| 58 | PPT1 | 6450440 | 16634 | -0.245 | -0.6458 | Yes | ||
| 59 | LST1 | 5420372 | 16854 | -0.282 | -0.6351 | Yes | ||
| 60 | SPON2 | 2680136 | 17077 | -0.322 | -0.6213 | Yes | ||
| 61 | FEZ2 | 5910181 | 17249 | -0.358 | -0.6018 | Yes | ||
| 62 | RTN4RL1 | 2630368 | 17688 | -0.486 | -0.5865 | Yes | ||
| 63 | MAP1S | 1980463 | 17738 | -0.504 | -0.5488 | Yes | ||
| 64 | RTN4 | 50725 630647 870097 870184 | 17755 | -0.511 | -0.5087 | Yes | ||
| 65 | AGRN | 6770152 | 17971 | -0.624 | -0.4704 | Yes | ||
| 66 | TRAPPC4 | 520044 | 17982 | -0.630 | -0.4205 | Yes | ||
| 67 | PICK1 | 3990500 4920500 | 18465 | -1.411 | -0.3335 | Yes | ||
| 68 | DTX1 | 5900372 | 18604 | -4.268 | 0.0006 | Yes |