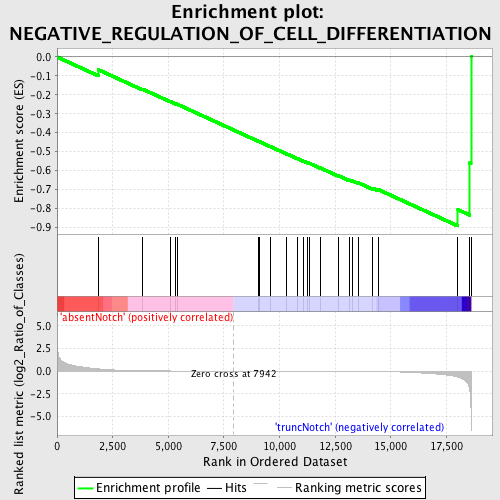
Profile of the Running ES Score & Positions of GeneSet Members on the Rank Ordered List
| Dataset | Set_03_absentNotch_versus_truncNotch.phenotype_absentNotch_versus_truncNotch.cls #absentNotch_versus_truncNotch.phenotype_absentNotch_versus_truncNotch.cls #absentNotch_versus_truncNotch_repos |
| Phenotype | phenotype_absentNotch_versus_truncNotch.cls#absentNotch_versus_truncNotch_repos |
| Upregulated in class | truncNotch |
| GeneSet | NEGATIVE_REGULATION_OF_CELL_DIFFERENTIATION |
| Enrichment Score (ES) | -0.8928037 |
| Normalized Enrichment Score (NES) | -1.694238 |
| Nominal p-value | 0.0 |
| FDR q-value | 0.07367949 |
| FWER p-Value | 0.15 |
| PROBE | DESCRIPTION (from dataset) | GENE SYMBOL | GENE_TITLE | RANK IN GENE LIST | RANK METRIC SCORE | RUNNING ES | CORE ENRICHMENT | |
|---|---|---|---|---|---|---|---|---|
| 1 | LDB1 | 5270601 | 1854 | 0.244 | -0.0674 | No | ||
| 2 | CDK6 | 4920253 | 3844 | 0.034 | -0.1700 | No | ||
| 3 | SHH | 5570400 | 5085 | 0.011 | -0.2352 | No | ||
| 4 | CALCA | 5860167 | 5339 | 0.009 | -0.2476 | No | ||
| 5 | NOTCH2 | 2570397 | 5426 | 0.009 | -0.2511 | No | ||
| 6 | PF4 | 6130332 | 9052 | -0.003 | -0.4457 | No | ||
| 7 | NF1 | 6980433 | 9083 | -0.003 | -0.4469 | No | ||
| 8 | MAFB | 1230471 | 9611 | -0.004 | -0.4747 | No | ||
| 9 | BMP4 | 380113 | 10330 | -0.007 | -0.5124 | No | ||
| 10 | CNTN4 | 1780300 5570577 6370019 | 10810 | -0.008 | -0.5371 | No | ||
| 11 | GPR98 | 6400647 | 11095 | -0.009 | -0.5512 | No | ||
| 12 | EREG | 50519 4920129 | 11266 | -0.010 | -0.5590 | No | ||
| 13 | NOTCH4 | 2450040 6370707 | 11342 | -0.010 | -0.5617 | No | ||
| 14 | CARTPT | 6660687 | 11822 | -0.013 | -0.5857 | No | ||
| 15 | TBX3 | 2570672 | 12640 | -0.019 | -0.6271 | No | ||
| 16 | ZBTB16 | 3290022 | 13124 | -0.024 | -0.6499 | No | ||
| 17 | IL4 | 6020537 | 13283 | -0.026 | -0.6549 | No | ||
| 18 | INHA | 6100102 | 13546 | -0.031 | -0.6650 | No | ||
| 19 | NPHP3 | 2450497 7050731 | 14162 | -0.043 | -0.6923 | No | ||
| 20 | SOCS5 | 3830398 7100093 | 14428 | -0.050 | -0.6999 | No | ||
| 21 | TWIST2 | 6760433 | 18015 | -0.652 | -0.8067 | Yes | ||
| 22 | NOTCH1 | 3390114 | 18550 | -2.087 | -0.5600 | Yes | ||
| 23 | DTX1 | 5900372 | 18604 | -4.268 | 0.0006 | Yes |

