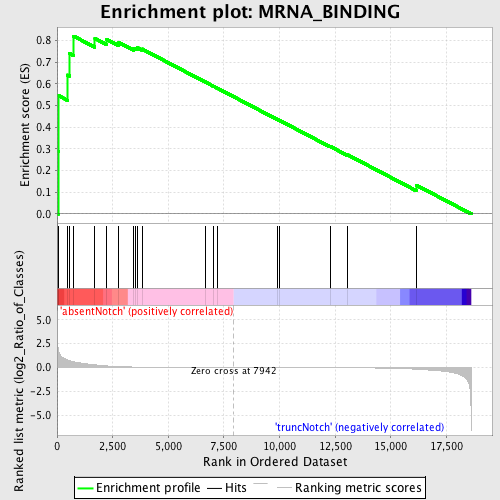
Profile of the Running ES Score & Positions of GeneSet Members on the Rank Ordered List
| Dataset | Set_03_absentNotch_versus_truncNotch.phenotype_absentNotch_versus_truncNotch.cls #absentNotch_versus_truncNotch.phenotype_absentNotch_versus_truncNotch.cls #absentNotch_versus_truncNotch_repos |
| Phenotype | phenotype_absentNotch_versus_truncNotch.cls#absentNotch_versus_truncNotch_repos |
| Upregulated in class | absentNotch |
| GeneSet | MRNA_BINDING |
| Enrichment Score (ES) | 0.8202965 |
| Normalized Enrichment Score (NES) | 1.5212387 |
| Nominal p-value | 0.012219959 |
| FDR q-value | 0.35508206 |
| FWER p-Value | 0.995 |
| PROBE | DESCRIPTION (from dataset) | GENE SYMBOL | GENE_TITLE | RANK IN GENE LIST | RANK METRIC SCORE | RUNNING ES | CORE ENRICHMENT | |
|---|---|---|---|---|---|---|---|---|
| 1 | HNRPDL | 1050102 1090181 5360471 | 44 | 2.002 | 0.2899 | Yes | ||
| 2 | PABPC1 | 2650180 2690253 6020632 1990270 | 58 | 1.760 | 0.5460 | Yes | ||
| 3 | EIF4A1 | 1990341 2810300 | 460 | 0.798 | 0.6410 | Yes | ||
| 4 | GRSF1 | 2100184 | 555 | 0.719 | 0.7409 | Yes | ||
| 5 | HNRPAB | 540504 | 740 | 0.612 | 0.8203 | Yes | ||
| 6 | PURB | 5360138 | 1700 | 0.280 | 0.8096 | No | ||
| 7 | CPSF1 | 6290064 | 2230 | 0.165 | 0.8052 | No | ||
| 8 | PABPC4 | 1990170 6760270 5390138 | 2773 | 0.099 | 0.7906 | No | ||
| 9 | ELAVL4 | 50735 3360086 5220167 | 3431 | 0.053 | 0.7629 | No | ||
| 10 | RPL35 | 6940070 | 3518 | 0.049 | 0.7654 | No | ||
| 11 | ZFP36L1 | 2510138 4120048 | 3613 | 0.044 | 0.7667 | No | ||
| 12 | EIF4A3 | 3440538 | 3816 | 0.035 | 0.7610 | No | ||
| 13 | TIA1 | 4670373 | 6649 | 0.004 | 0.6092 | No | ||
| 14 | SLBP | 6220601 | 7017 | 0.002 | 0.5898 | No | ||
| 15 | AUH | 5570152 | 7201 | 0.002 | 0.5803 | No | ||
| 16 | SSB | 460286 3140717 | 9915 | -0.005 | 0.4352 | No | ||
| 17 | FMR1 | 5050075 | 10007 | -0.006 | 0.4311 | No | ||
| 18 | PARN | 3840129 | 12276 | -0.016 | 0.3115 | No | ||
| 19 | ELAVL2 | 360181 | 13069 | -0.024 | 0.2723 | No | ||
| 20 | ZFP36 | 2030605 | 16142 | -0.177 | 0.1330 | No |

