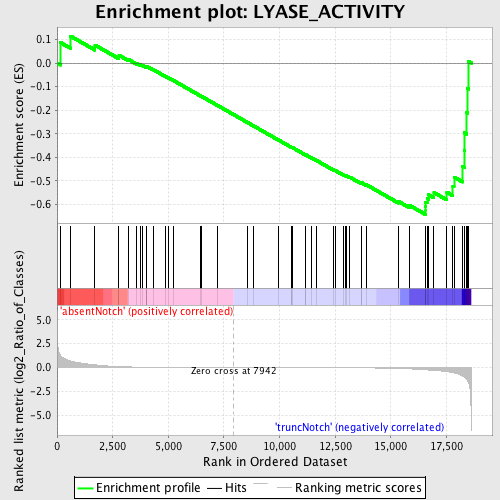
Profile of the Running ES Score & Positions of GeneSet Members on the Rank Ordered List
| Dataset | Set_03_absentNotch_versus_truncNotch.phenotype_absentNotch_versus_truncNotch.cls #absentNotch_versus_truncNotch.phenotype_absentNotch_versus_truncNotch.cls #absentNotch_versus_truncNotch_repos |
| Phenotype | phenotype_absentNotch_versus_truncNotch.cls#absentNotch_versus_truncNotch_repos |
| Upregulated in class | truncNotch |
| GeneSet | LYASE_ACTIVITY |
| Enrichment Score (ES) | -0.64267075 |
| Normalized Enrichment Score (NES) | -1.4335808 |
| Nominal p-value | 0.03538175 |
| FDR q-value | 1.0 |
| FWER p-Value | 1.0 |
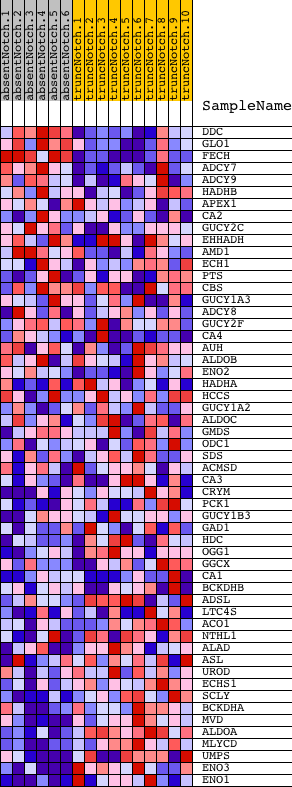
| PROBE | DESCRIPTION (from dataset) | GENE SYMBOL | GENE_TITLE | RANK IN GENE LIST | RANK METRIC SCORE | RUNNING ES | CORE ENRICHMENT | |
|---|---|---|---|---|---|---|---|---|
| 1 | DDC | 670408 | 154 | 1.268 | 0.0870 | No | ||
| 2 | GLO1 | 7040692 | 604 | 0.686 | 0.1144 | No | ||
| 3 | FECH | 2810605 3120088 4920411 | 1702 | 0.279 | 0.0763 | No | ||
| 4 | ADCY7 | 6290520 7560739 | 2779 | 0.099 | 0.0257 | No | ||
| 5 | ADCY9 | 5690168 | 2780 | 0.099 | 0.0331 | No | ||
| 6 | HADHB | 60064 2690670 | 3216 | 0.065 | 0.0146 | No | ||
| 7 | APEX1 | 3190519 | 3577 | 0.045 | -0.0014 | No | ||
| 8 | CA2 | 1660113 1660600 | 3739 | 0.038 | -0.0072 | No | ||
| 9 | GUCY2C | 110411 6110156 | 3838 | 0.034 | -0.0099 | No | ||
| 10 | EHHADH | 6200315 | 4004 | 0.029 | -0.0167 | No | ||
| 11 | AMD1 | 6290128 | 4016 | 0.028 | -0.0152 | No | ||
| 12 | ECH1 | 4120746 | 4037 | 0.027 | -0.0142 | No | ||
| 13 | PTS | 1500270 | 4314 | 0.021 | -0.0275 | No | ||
| 14 | CBS | 5420450 6660039 | 4859 | 0.013 | -0.0558 | No | ||
| 15 | GUCY1A3 | 110253 2640735 4070037 | 5003 | 0.012 | -0.0627 | No | ||
| 16 | ADCY8 | 6760519 | 5226 | 0.010 | -0.0739 | No | ||
| 17 | GUCY2F | 2450309 | 6435 | 0.004 | -0.1386 | No | ||
| 18 | CA4 | 130100 | 6499 | 0.004 | -0.1417 | No | ||
| 19 | AUH | 5570152 | 7201 | 0.002 | -0.1793 | No | ||
| 20 | ALDOB | 4730324 | 8552 | -0.001 | -0.2520 | No | ||
| 21 | ENO2 | 2320068 | 8815 | -0.002 | -0.2659 | No | ||
| 22 | HADHA | 3190041 | 9959 | -0.005 | -0.3271 | No | ||
| 23 | HCCS | 670397 3170341 | 10530 | -0.007 | -0.3572 | No | ||
| 24 | GUCY1A2 | 1660441 | 10540 | -0.007 | -0.3572 | No | ||
| 25 | ALDOC | 450121 610427 | 10575 | -0.007 | -0.3584 | No | ||
| 26 | GMDS | 1050519 | 11171 | -0.010 | -0.3898 | No | ||
| 27 | ODC1 | 5670168 | 11181 | -0.010 | -0.3896 | No | ||
| 28 | SDS | 110242 6380725 | 11426 | -0.011 | -0.4019 | No | ||
| 29 | ACMSD | 1450538 | 11674 | -0.012 | -0.4143 | No | ||
| 30 | CA3 | 870687 5890390 | 12418 | -0.017 | -0.4530 | No | ||
| 31 | CRYM | 3940528 | 12492 | -0.018 | -0.4556 | No | ||
| 32 | PCK1 | 7000358 | 12894 | -0.022 | -0.4756 | No | ||
| 33 | GUCY1B3 | 2970020 | 12968 | -0.023 | -0.4778 | No | ||
| 34 | GAD1 | 2360035 3140167 | 12997 | -0.023 | -0.4776 | No | ||
| 35 | HDC | 4150463 | 13161 | -0.025 | -0.4846 | No | ||
| 36 | OGG1 | 1940279 | 13680 | -0.033 | -0.5100 | No | ||
| 37 | GGCX | 770377 3990441 | 13682 | -0.033 | -0.5075 | No | ||
| 38 | CA1 | 1340204 | 13906 | -0.037 | -0.5167 | No | ||
| 39 | BCKDHB | 780372 | 15342 | -0.091 | -0.5872 | No | ||
| 40 | ADSL | 5570484 | 15830 | -0.135 | -0.6033 | No | ||
| 41 | LTC4S | 2570411 | 16562 | -0.235 | -0.6250 | Yes | ||
| 42 | ACO1 | 50114 | 16565 | -0.236 | -0.6074 | Yes | ||
| 43 | NTHL1 | 4920148 | 16573 | -0.237 | -0.5900 | Yes | ||
| 44 | ALAD | 780576 | 16636 | -0.246 | -0.5748 | Yes | ||
| 45 | ASL | 1240601 5340309 5360082 | 16685 | -0.254 | -0.5583 | Yes | ||
| 46 | UROD | 2470494 | 16939 | -0.298 | -0.5496 | Yes | ||
| 47 | ECHS1 | 2970184 | 17522 | -0.433 | -0.5484 | Yes | ||
| 48 | SCLY | 730497 | 17790 | -0.529 | -0.5231 | Yes | ||
| 49 | BCKDHA | 50189 | 17841 | -0.556 | -0.4840 | Yes | ||
| 50 | MVD | 2060717 | 18228 | -0.875 | -0.4391 | Yes | ||
| 51 | ALDOA | 6290672 | 18304 | -0.964 | -0.3707 | Yes | ||
| 52 | MLYCD | 6760181 | 18322 | -1.000 | -0.2964 | Yes | ||
| 53 | UMPS | 2340541 4730438 | 18418 | -1.214 | -0.2103 | Yes | ||
| 54 | ENO3 | 5270136 | 18458 | -1.372 | -0.1092 | Yes | ||
| 55 | ENO1 | 5340128 | 18494 | -1.566 | 0.0066 | Yes |