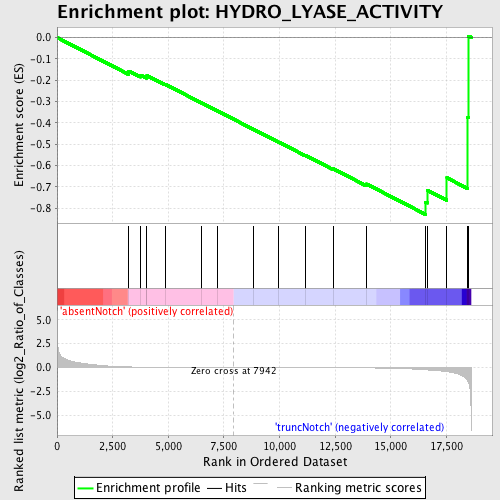
Profile of the Running ES Score & Positions of GeneSet Members on the Rank Ordered List
| Dataset | Set_03_absentNotch_versus_truncNotch.phenotype_absentNotch_versus_truncNotch.cls #absentNotch_versus_truncNotch.phenotype_absentNotch_versus_truncNotch.cls #absentNotch_versus_truncNotch_repos |
| Phenotype | phenotype_absentNotch_versus_truncNotch.cls#absentNotch_versus_truncNotch_repos |
| Upregulated in class | truncNotch |
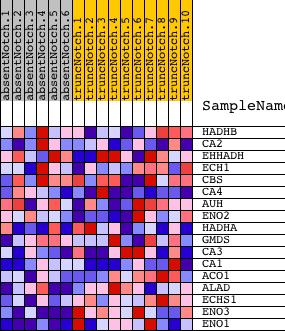
| GeneSet | HYDRO_LYASE_ACTIVITY |
| Enrichment Score (ES) | -0.8291347 |
| Normalized Enrichment Score (NES) | -1.5258025 |
| Nominal p-value | 0.015122874 |
| FDR q-value | 0.6790569 |
| FWER p-Value | 0.998 |
| PROBE | DESCRIPTION (from dataset) | GENE SYMBOL | GENE_TITLE | RANK IN GENE LIST | RANK METRIC SCORE | RUNNING ES | CORE ENRICHMENT | |
|---|---|---|---|---|---|---|---|---|
| 1 | HADHB | 60064 2690670 | 3216 | 0.065 | -0.1570 | No | ||
| 2 | CA2 | 1660113 1660600 | 3739 | 0.038 | -0.1758 | No | ||
| 3 | EHHADH | 6200315 | 4004 | 0.029 | -0.1831 | No | ||
| 4 | ECH1 | 4120746 | 4037 | 0.027 | -0.1781 | No | ||
| 5 | CBS | 5420450 6660039 | 4859 | 0.013 | -0.2191 | No | ||
| 6 | CA4 | 130100 | 6499 | 0.004 | -0.3062 | No | ||
| 7 | AUH | 5570152 | 7201 | 0.002 | -0.3434 | No | ||
| 8 | ENO2 | 2320068 | 8815 | -0.002 | -0.4296 | No | ||
| 9 | HADHA | 3190041 | 9959 | -0.005 | -0.4897 | No | ||
| 10 | GMDS | 1050519 | 11171 | -0.010 | -0.5525 | No | ||
| 11 | CA3 | 870687 5890390 | 12418 | -0.017 | -0.6153 | No | ||
| 12 | CA1 | 1340204 | 13906 | -0.037 | -0.6862 | No | ||
| 13 | ACO1 | 50114 | 16565 | -0.236 | -0.7716 | Yes | ||
| 14 | ALAD | 780576 | 16636 | -0.246 | -0.7155 | Yes | ||
| 15 | ECHS1 | 2970184 | 17522 | -0.433 | -0.6575 | Yes | ||
| 16 | ENO3 | 5270136 | 18458 | -1.372 | -0.3733 | Yes | ||
| 17 | ENO1 | 5340128 | 18494 | -1.566 | 0.0066 | Yes |