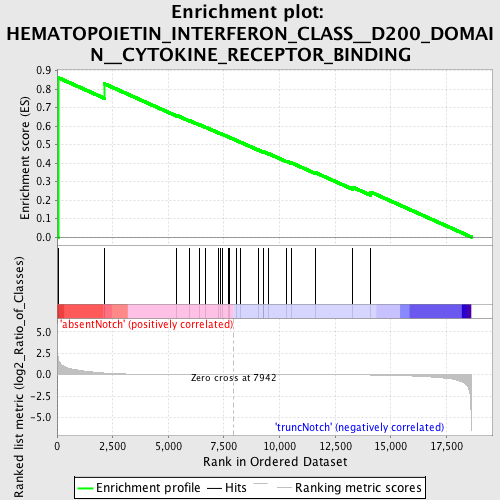
Profile of the Running ES Score & Positions of GeneSet Members on the Rank Ordered List
| Dataset | Set_03_absentNotch_versus_truncNotch.phenotype_absentNotch_versus_truncNotch.cls #absentNotch_versus_truncNotch.phenotype_absentNotch_versus_truncNotch.cls #absentNotch_versus_truncNotch_repos |
| Phenotype | phenotype_absentNotch_versus_truncNotch.cls#absentNotch_versus_truncNotch_repos |
| Upregulated in class | absentNotch |
| GeneSet | HEMATOPOIETIN_INTERFERON_CLASS__D200_DOMAIN__CYTOKINE_RECEPTOR_BINDING |
| Enrichment Score (ES) | 0.8620467 |
| Normalized Enrichment Score (NES) | 1.6586471 |
| Nominal p-value | 0.002016129 |
| FDR q-value | 0.11236368 |
| FWER p-Value | 0.333 |
| PROBE | DESCRIPTION (from dataset) | GENE SYMBOL | GENE_TITLE | RANK IN GENE LIST | RANK METRIC SCORE | RUNNING ES | CORE ENRICHMENT | |
|---|---|---|---|---|---|---|---|---|
| 1 | IL5 | 6370364 1050193 | 42 | 2.062 | 0.8620 | Yes | ||
| 2 | CNTF | 450128 870253 1780068 6520195 | 2120 | 0.188 | 0.8290 | No | ||
| 3 | IFNA13 | 1980086 | 5379 | 0.009 | 0.6575 | No | ||
| 4 | IFNA7 | 2510239 | 5962 | 0.006 | 0.6288 | No | ||
| 5 | PRL | 3440435 | 6411 | 0.004 | 0.6065 | No | ||
| 6 | IL21 | 1850047 | 6682 | 0.003 | 0.5935 | No | ||
| 7 | IL2 | 1770725 | 7275 | 0.002 | 0.5623 | No | ||
| 8 | IFNG | 5670592 | 7330 | 0.002 | 0.5601 | No | ||
| 9 | IFNA5 | 4780072 | 7442 | 0.001 | 0.5546 | No | ||
| 10 | IFNA2 | 4150162 | 7694 | 0.001 | 0.5414 | No | ||
| 11 | IFNA14 | 4540142 | 7760 | 0.000 | 0.5381 | No | ||
| 12 | IL7 | 5360440 | 8071 | -0.000 | 0.5215 | No | ||
| 13 | IL25 | 60041 | 8253 | -0.001 | 0.5121 | No | ||
| 14 | SDCBP | 460487 2190039 5270441 | 9036 | -0.003 | 0.4712 | No | ||
| 15 | CSF3 | 2230193 6660707 | 9270 | -0.003 | 0.4601 | No | ||
| 16 | CSF2 | 1660593 | 9289 | -0.003 | 0.4605 | No | ||
| 17 | IFNK | 5690064 | 9522 | -0.004 | 0.4497 | No | ||
| 18 | IL3 | 2480280 | 10302 | -0.006 | 0.4105 | No | ||
| 19 | IL12B | 460008 | 10523 | -0.007 | 0.4017 | No | ||
| 20 | IFNA4 | 1940025 | 11631 | -0.012 | 0.3471 | No | ||
| 21 | IL4 | 6020537 | 13283 | -0.026 | 0.2693 | No | ||
| 22 | CTF1 | 2060025 | 14101 | -0.042 | 0.2428 | No |

