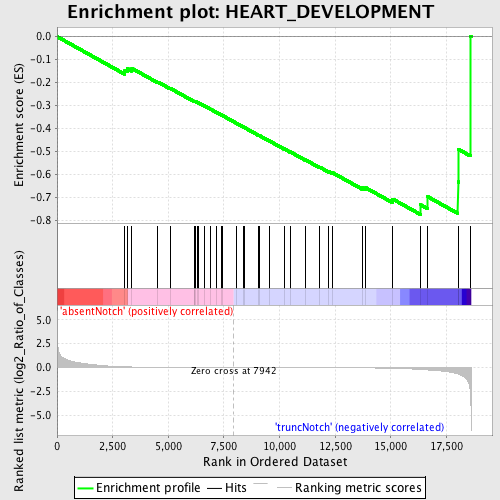
Profile of the Running ES Score & Positions of GeneSet Members on the Rank Ordered List
| Dataset | Set_03_absentNotch_versus_truncNotch.phenotype_absentNotch_versus_truncNotch.cls #absentNotch_versus_truncNotch.phenotype_absentNotch_versus_truncNotch.cls #absentNotch_versus_truncNotch_repos |
| Phenotype | phenotype_absentNotch_versus_truncNotch.cls#absentNotch_versus_truncNotch_repos |
| Upregulated in class | truncNotch |
| GeneSet | HEART_DEVELOPMENT |
| Enrichment Score (ES) | -0.77386063 |
| Normalized Enrichment Score (NES) | -1.5816306 |
| Nominal p-value | 0.007751938 |
| FDR q-value | 0.67649084 |
| FWER p-Value | 0.904 |
| PROBE | DESCRIPTION (from dataset) | GENE SYMBOL | GENE_TITLE | RANK IN GENE LIST | RANK METRIC SCORE | RUNNING ES | CORE ENRICHMENT | |
|---|---|---|---|---|---|---|---|---|
| 1 | CENTA2 | 4920451 | 3044 | 0.077 | -0.1477 | No | ||
| 2 | GATA4 | 1410215 2690609 | 3159 | 0.069 | -0.1393 | No | ||
| 3 | CITED2 | 5670114 5130088 | 3359 | 0.057 | -0.1381 | No | ||
| 4 | SHOX2 | 3190438 6450059 | 4530 | 0.017 | -0.1975 | No | ||
| 5 | SHH | 5570400 | 5085 | 0.011 | -0.2250 | No | ||
| 6 | MYH7 | 5690131 6220398 | 6162 | 0.005 | -0.2818 | No | ||
| 7 | NKX2-6 | 5670204 | 6185 | 0.005 | -0.2819 | No | ||
| 8 | TGFB2 | 4920292 | 6205 | 0.005 | -0.2819 | No | ||
| 9 | POU6F1 | 6200168 | 6326 | 0.005 | -0.2874 | No | ||
| 10 | MYH11 | 7100273 | 6369 | 0.004 | -0.2887 | No | ||
| 11 | PLCE1 | 4780685 | 6611 | 0.004 | -0.3009 | No | ||
| 12 | TBX5 | 2900132 6370484 | 6908 | 0.003 | -0.3162 | No | ||
| 13 | IRX4 | 1980102 | 7172 | 0.002 | -0.3300 | No | ||
| 14 | TDGF1 | 1690338 6760070 | 7389 | 0.001 | -0.3413 | No | ||
| 15 | CASQ2 | 3170136 | 7433 | 0.001 | -0.3433 | No | ||
| 16 | HAND1 | 3610647 | 8078 | -0.000 | -0.3779 | No | ||
| 17 | BMP10 | 3060068 | 8393 | -0.001 | -0.3946 | No | ||
| 18 | MKKS | 2760722 3390563 | 8439 | -0.001 | -0.3968 | No | ||
| 19 | MYH6 | 2900373 | 9057 | -0.003 | -0.4294 | No | ||
| 20 | NF1 | 6980433 | 9083 | -0.003 | -0.4301 | No | ||
| 21 | NCOA6 | 1780333 6450110 | 9535 | -0.004 | -0.4535 | No | ||
| 22 | ERBB2 | 3830673 | 10206 | -0.006 | -0.4883 | No | ||
| 23 | HAND2 | 4670142 | 10480 | -0.007 | -0.5015 | No | ||
| 24 | FGF12 | 1740446 2360037 | 11163 | -0.009 | -0.5362 | No | ||
| 25 | TBX1 | 3710133 6590121 | 11809 | -0.013 | -0.5683 | No | ||
| 26 | BMP2 | 6620687 | 12217 | -0.015 | -0.5869 | No | ||
| 27 | GLI2 | 3060632 | 12387 | -0.017 | -0.5925 | No | ||
| 28 | ECE2 | 4070750 | 13739 | -0.034 | -0.6581 | No | ||
| 29 | MYBPC3 | 650390 | 13878 | -0.037 | -0.6578 | No | ||
| 30 | DVL3 | 360156 5390075 | 15081 | -0.076 | -0.7066 | No | ||
| 31 | FBN1 | 3170181 | 16332 | -0.204 | -0.7312 | Yes | ||
| 32 | TAZ | 7100193 | 16660 | -0.250 | -0.6966 | Yes | ||
| 33 | DVL1 | 5900450 6510162 | 18019 | -0.658 | -0.6321 | Yes | ||
| 34 | VANGL2 | 70097 870075 | 18049 | -0.683 | -0.4909 | Yes | ||
| 35 | SRI | 3390446 4850064 | 18576 | -2.493 | 0.0022 | Yes |

