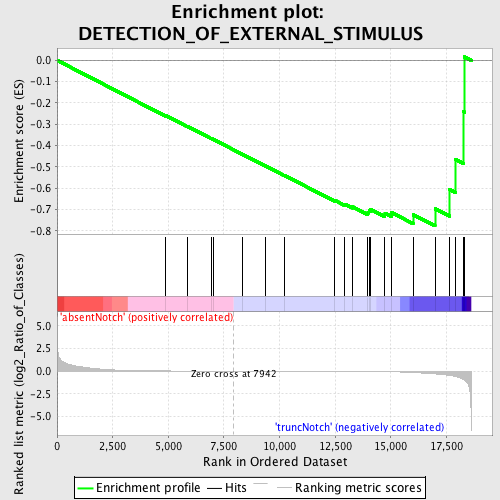
Profile of the Running ES Score & Positions of GeneSet Members on the Rank Ordered List
| Dataset | Set_03_absentNotch_versus_truncNotch.phenotype_absentNotch_versus_truncNotch.cls #absentNotch_versus_truncNotch.phenotype_absentNotch_versus_truncNotch.cls #absentNotch_versus_truncNotch_repos |
| Phenotype | phenotype_absentNotch_versus_truncNotch.cls#absentNotch_versus_truncNotch_repos |
| Upregulated in class | truncNotch |
| GeneSet | DETECTION_OF_EXTERNAL_STIMULUS |
| Enrichment Score (ES) | -0.7771941 |
| Normalized Enrichment Score (NES) | -1.452179 |
| Nominal p-value | 0.046242774 |
| FDR q-value | 1.0 |
| FWER p-Value | 1.0 |
| PROBE | DESCRIPTION (from dataset) | GENE SYMBOL | GENE_TITLE | RANK IN GENE LIST | RANK METRIC SCORE | RUNNING ES | CORE ENRICHMENT | |
|---|---|---|---|---|---|---|---|---|
| 1 | OPN1SW | 6420377 | 4893 | 0.013 | -0.2598 | No | ||
| 2 | PGLYRP3 | 6350403 | 5852 | 0.007 | -0.3096 | No | ||
| 3 | NLRC4 | 5570332 | 6950 | 0.003 | -0.3679 | No | ||
| 4 | NOD2 | 2510050 | 7036 | 0.002 | -0.3718 | No | ||
| 5 | NR2E3 | 7050465 | 8344 | -0.001 | -0.4418 | No | ||
| 6 | GRK1 | 1410112 | 9352 | -0.004 | -0.4950 | No | ||
| 7 | TRPC3 | 840064 | 10226 | -0.006 | -0.5403 | No | ||
| 8 | ABCA4 | 2370064 3940711 | 12466 | -0.018 | -0.6561 | No | ||
| 9 | GRM6 | 2030398 | 12927 | -0.022 | -0.6750 | No | ||
| 10 | PDC | 3140400 3780184 | 13265 | -0.026 | -0.6863 | No | ||
| 11 | RHO | 4280398 | 13970 | -0.038 | -0.7140 | No | ||
| 12 | OPN4 | 5670091 | 14019 | -0.040 | -0.7061 | No | ||
| 13 | PDE6B | 2480187 | 14079 | -0.041 | -0.6985 | No | ||
| 14 | CACNA1F | 2360605 3390450 | 14736 | -0.060 | -0.7179 | No | ||
| 15 | SAG | 6550603 | 15037 | -0.074 | -0.7145 | No | ||
| 16 | PGLYRP4 | 3780411 | 16003 | -0.160 | -0.7243 | Yes | ||
| 17 | PGLYRP1 | 6760242 | 16988 | -0.306 | -0.6963 | Yes | ||
| 18 | UNC119 | 360372 | 17645 | -0.473 | -0.6067 | Yes | ||
| 19 | NOD1 | 2360368 | 17908 | -0.592 | -0.4645 | Yes | ||
| 20 | PGLYRP2 | 2340086 | 18258 | -0.919 | -0.2406 | Yes | ||
| 21 | PITPNM1 | 4540528 | 18312 | -0.984 | 0.0163 | Yes |

