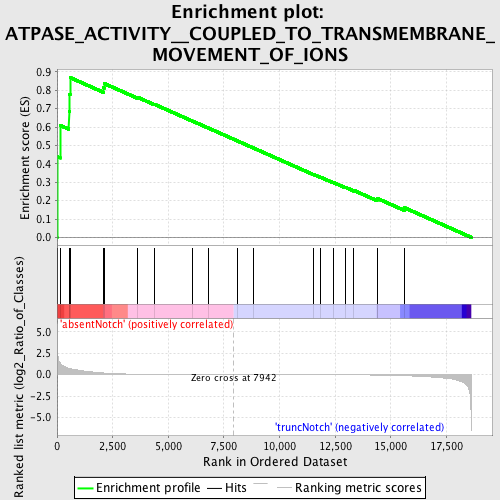
Profile of the Running ES Score & Positions of GeneSet Members on the Rank Ordered List
| Dataset | Set_03_absentNotch_versus_truncNotch.phenotype_absentNotch_versus_truncNotch.cls #absentNotch_versus_truncNotch.phenotype_absentNotch_versus_truncNotch.cls #absentNotch_versus_truncNotch_repos |
| Phenotype | phenotype_absentNotch_versus_truncNotch.cls#absentNotch_versus_truncNotch_repos |
| Upregulated in class | absentNotch |
| GeneSet | ATPASE_ACTIVITY__COUPLED_TO_TRANSMEMBRANE_MOVEMENT_OF_IONS |
| Enrichment Score (ES) | 0.8688989 |
| Normalized Enrichment Score (NES) | 1.6653285 |
| Nominal p-value | 0.0 |
| FDR q-value | 0.12886238 |
| FWER p-Value | 0.296 |

| PROBE | DESCRIPTION (from dataset) | GENE SYMBOL | GENE_TITLE | RANK IN GENE LIST | RANK METRIC SCORE | RUNNING ES | CORE ENRICHMENT | |
|---|---|---|---|---|---|---|---|---|
| 1 | ATP2A3 | 130440 2190451 | 4 | 3.349 | 0.4386 | Yes | ||
| 2 | ATP2A2 | 1090075 3990279 | 134 | 1.356 | 0.6093 | Yes | ||
| 3 | ATP1B1 | 3130594 | 534 | 0.740 | 0.6848 | Yes | ||
| 4 | ATP1B3 | 6040128 | 547 | 0.726 | 0.7793 | Yes | ||
| 5 | ATP6V1C1 | 2690324 5220528 | 587 | 0.700 | 0.8689 | Yes | ||
| 6 | ATP6V1B2 | 4060528 | 2090 | 0.193 | 0.8134 | No | ||
| 7 | ATP1A1 | 5670451 | 2116 | 0.189 | 0.8368 | No | ||
| 8 | ATP6V0E1 | 6760053 | 3610 | 0.044 | 0.7623 | No | ||
| 9 | FXYD2 | 1400280 2350719 3520184 7040377 | 4380 | 0.020 | 0.7235 | No | ||
| 10 | ATP2B3 | 2260022 3780059 | 6094 | 0.006 | 0.6321 | No | ||
| 11 | ATP1B2 | 4480603 | 6819 | 0.003 | 0.5936 | No | ||
| 12 | ATP4A | 6220154 | 8116 | -0.000 | 0.5239 | No | ||
| 13 | ATP7A | 6550168 | 8838 | -0.002 | 0.4855 | No | ||
| 14 | ABCB11 | 7040170 | 11534 | -0.011 | 0.3420 | No | ||
| 15 | ATP1A2 | 110278 | 11839 | -0.013 | 0.3274 | No | ||
| 16 | ATP7B | 2060711 2470039 3140301 6650735 | 12420 | -0.017 | 0.2984 | No | ||
| 17 | ATP1A3 | 5690674 | 12947 | -0.022 | 0.2731 | No | ||
| 18 | ATP4B | 1740156 | 13340 | -0.027 | 0.2555 | No | ||
| 19 | ATP2C1 | 2630446 6520253 | 14382 | -0.049 | 0.2060 | No | ||
| 20 | ATP6V0C | 1780609 | 14412 | -0.050 | 0.2110 | No | ||
| 21 | ATP2A1 | 110309 | 15626 | -0.115 | 0.1608 | No |

