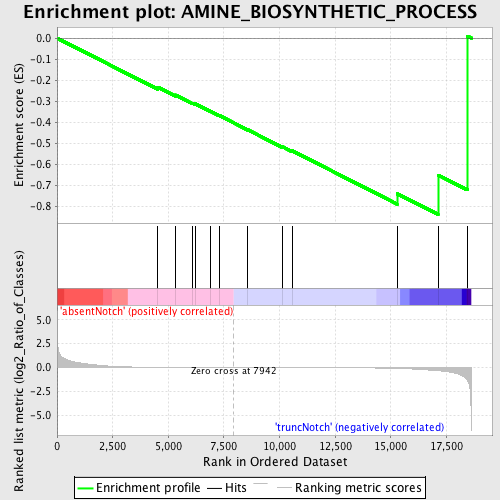
Profile of the Running ES Score & Positions of GeneSet Members on the Rank Ordered List
| Dataset | Set_03_absentNotch_versus_truncNotch.phenotype_absentNotch_versus_truncNotch.cls #absentNotch_versus_truncNotch.phenotype_absentNotch_versus_truncNotch.cls #absentNotch_versus_truncNotch_repos |
| Phenotype | phenotype_absentNotch_versus_truncNotch.cls#absentNotch_versus_truncNotch_repos |
| Upregulated in class | truncNotch |
| GeneSet | AMINE_BIOSYNTHETIC_PROCESS |
| Enrichment Score (ES) | -0.8382232 |
| Normalized Enrichment Score (NES) | -1.4320884 |
| Nominal p-value | 0.046332046 |
| FDR q-value | 1.0 |
| FWER p-Value | 1.0 |
| PROBE | DESCRIPTION (from dataset) | GENE SYMBOL | GENE_TITLE | RANK IN GENE LIST | RANK METRIC SCORE | RUNNING ES | CORE ENRICHMENT | |
|---|---|---|---|---|---|---|---|---|
| 1 | PRG3 | 6220020 | 4527 | 0.017 | -0.2336 | No | ||
| 2 | MAT2B | 1690139 2510706 | 5309 | 0.009 | -0.2702 | No | ||
| 3 | PLOD1 | 6040427 | 6079 | 0.006 | -0.3084 | No | ||
| 4 | TGFB2 | 4920292 | 6205 | 0.005 | -0.3122 | No | ||
| 5 | SLC5A7 | 4760091 | 6905 | 0.003 | -0.3483 | No | ||
| 6 | ALDH18A1 | 2340601 | 7279 | 0.002 | -0.3673 | No | ||
| 7 | CDO1 | 2480279 | 8579 | -0.002 | -0.4363 | No | ||
| 8 | BBOX1 | 2030538 2370452 | 10136 | -0.006 | -0.5165 | No | ||
| 9 | PAH | 3800309 | 10568 | -0.007 | -0.5355 | No | ||
| 10 | PYCR1 | 6180670 | 15283 | -0.088 | -0.7393 | Yes | ||
| 11 | OAZ1 | 110181 | 17125 | -0.331 | -0.6507 | Yes | ||
| 12 | BCAT1 | 3290128 4050408 | 18439 | -1.289 | 0.0095 | Yes |

