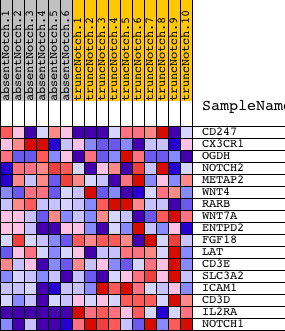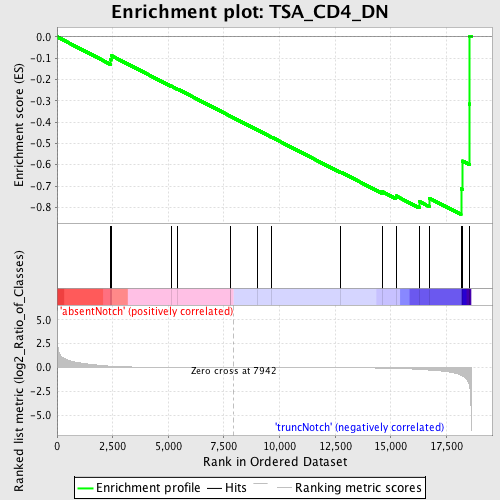
Profile of the Running ES Score & Positions of GeneSet Members on the Rank Ordered List
| Dataset | Set_03_absentNotch_versus_truncNotch.phenotype_absentNotch_versus_truncNotch.cls #absentNotch_versus_truncNotch.phenotype_absentNotch_versus_truncNotch.cls #absentNotch_versus_truncNotch_repos |
| Phenotype | phenotype_absentNotch_versus_truncNotch.cls#absentNotch_versus_truncNotch_repos |
| Upregulated in class | truncNotch |
| GeneSet | TSA_CD4_DN |
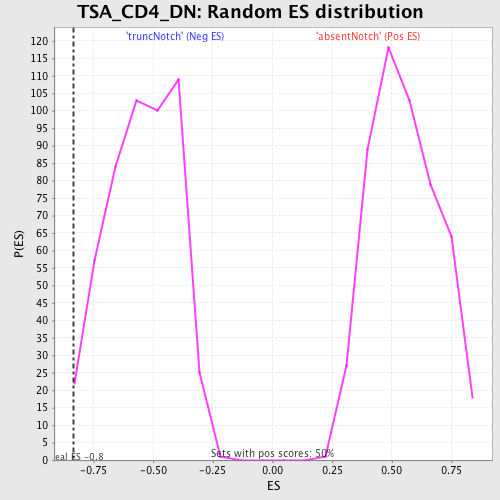
| Enrichment Score (ES) | -0.8336796 |
| Normalized Enrichment Score (NES) | -1.5309783 |
| Nominal p-value | 0.015968064 |
| FDR q-value | 0.48299912 |
| FWER p-Value | 0.999 |
| PROBE | DESCRIPTION (from dataset) | GENE SYMBOL | GENE_TITLE | RANK IN GENE LIST | RANK METRIC SCORE | RUNNING ES | CORE ENRICHMENT | |
|---|---|---|---|---|---|---|---|---|
| 1 | CD247 | 3800725 5720136 | 2391 | 0.144 | -0.1066 | No | ||
| 2 | CX3CR1 | 1690577 | 2429 | 0.137 | -0.0875 | No | ||
| 3 | OGDH | 3840333 6350100 | 5120 | 0.011 | -0.2305 | No | ||
| 4 | NOTCH2 | 2570397 | 5426 | 0.009 | -0.2456 | No | ||
| 5 | METAP2 | 1570441 4010026 4850204 | 7797 | 0.000 | -0.3730 | No | ||
| 6 | WNT4 | 4150619 | 7810 | 0.000 | -0.3736 | No | ||
| 7 | RARB | 430139 1410138 | 9016 | -0.003 | -0.4379 | No | ||
| 8 | WNT7A | 1170315 | 9654 | -0.004 | -0.4715 | No | ||
| 9 | ENTPD2 | 4590739 | 12756 | -0.020 | -0.6351 | No | ||
| 10 | FGF18 | 1410168 2190706 | 14632 | -0.057 | -0.7273 | No | ||
| 11 | LAT | 3170025 | 15232 | -0.084 | -0.7466 | No | ||
| 12 | CD3E | 3800056 | 16278 | -0.195 | -0.7729 | Yes | ||
| 13 | SLC3A2 | 5270358 | 16738 | -0.262 | -0.7575 | Yes | ||
| 14 | ICAM1 | 6980138 | 18156 | -0.795 | -0.7121 | Yes | ||
| 15 | CD3D | 2810739 | 18226 | -0.871 | -0.5825 | Yes | ||
| 16 | IL2RA | 6620450 | 18531 | -1.856 | -0.3149 | Yes | ||
| 17 | NOTCH1 | 3390114 | 18550 | -2.087 | 0.0035 | Yes |