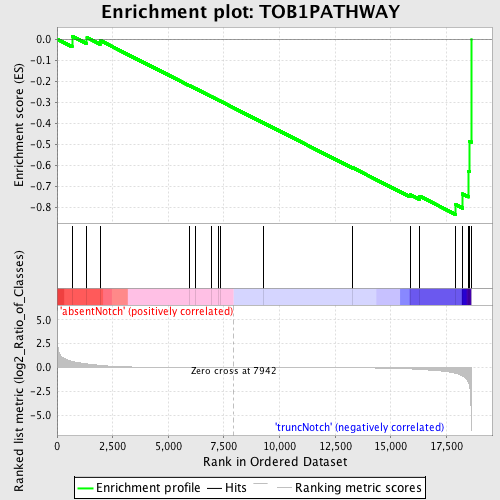
Profile of the Running ES Score & Positions of GeneSet Members on the Rank Ordered List
| Dataset | Set_03_absentNotch_versus_truncNotch.phenotype_absentNotch_versus_truncNotch.cls #absentNotch_versus_truncNotch.phenotype_absentNotch_versus_truncNotch.cls #absentNotch_versus_truncNotch_repos |
| Phenotype | phenotype_absentNotch_versus_truncNotch.cls#absentNotch_versus_truncNotch_repos |
| Upregulated in class | truncNotch |
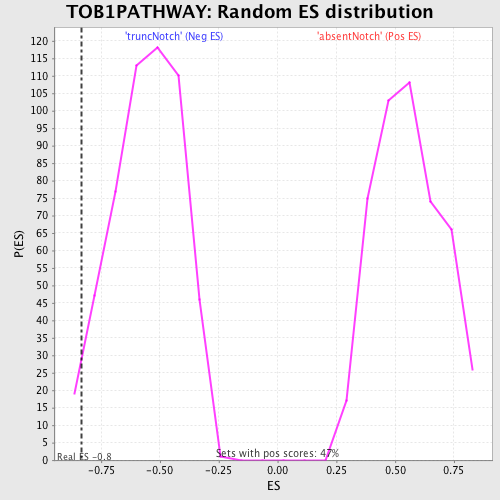
| GeneSet | TOB1PATHWAY |
| Enrichment Score (ES) | -0.8356118 |
| Normalized Enrichment Score (NES) | -1.5038937 |
| Nominal p-value | 0.030131826 |
| FDR q-value | 0.4996704 |
| FWER p-Value | 1.0 |
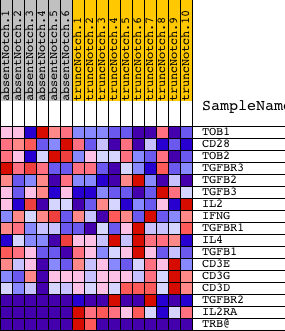
| PROBE | DESCRIPTION (from dataset) | GENE SYMBOL | GENE_TITLE | RANK IN GENE LIST | RANK METRIC SCORE | RUNNING ES | CORE ENRICHMENT | |
|---|---|---|---|---|---|---|---|---|
| 1 | TOB1 | 4150138 | 675 | 0.646 | 0.0141 | No | ||
| 2 | CD28 | 1400739 4210093 | 1342 | 0.375 | 0.0076 | No | ||
| 3 | TOB2 | 1240465 | 1933 | 0.225 | -0.0066 | No | ||
| 4 | TGFBR3 | 5290577 | 5937 | 0.006 | -0.2213 | No | ||
| 5 | TGFB2 | 4920292 | 6205 | 0.005 | -0.2353 | No | ||
| 6 | TGFB3 | 1070041 | 6932 | 0.003 | -0.2741 | No | ||
| 7 | IL2 | 1770725 | 7275 | 0.002 | -0.2924 | No | ||
| 8 | IFNG | 5670592 | 7330 | 0.002 | -0.2951 | No | ||
| 9 | TGFBR1 | 1400148 4280020 6550711 | 9263 | -0.003 | -0.3988 | No | ||
| 10 | IL4 | 6020537 | 13283 | -0.026 | -0.6128 | No | ||
| 11 | TGFB1 | 1940162 | 15875 | -0.140 | -0.7412 | No | ||
| 12 | CD3E | 3800056 | 16278 | -0.195 | -0.7475 | No | ||
| 13 | CD3G | 2680288 | 17917 | -0.596 | -0.7891 | Yes | ||
| 14 | CD3D | 2810739 | 18226 | -0.871 | -0.7377 | Yes | ||
| 15 | TGFBR2 | 1780711 1980537 6550398 | 18499 | -1.576 | -0.6294 | Yes | ||
| 16 | IL2RA | 6620450 | 18531 | -1.856 | -0.4862 | Yes | ||
| 17 | TRB@ | 3940292 | 18615 | -6.288 | 0.0001 | Yes |