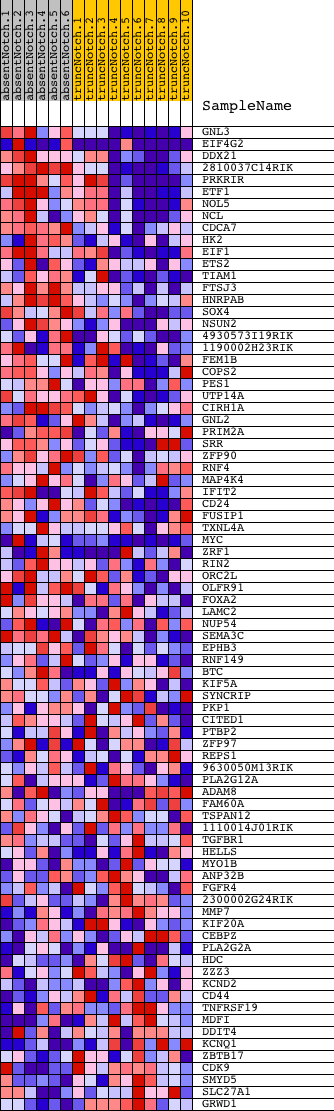
Profile of the Running ES Score & Positions of GeneSet Members on the Rank Ordered List
| Dataset | Set_03_absentNotch_versus_truncNotch.phenotype_absentNotch_versus_truncNotch.cls #absentNotch_versus_truncNotch.phenotype_absentNotch_versus_truncNotch.cls #absentNotch_versus_truncNotch_repos |
| Phenotype | phenotype_absentNotch_versus_truncNotch.cls#absentNotch_versus_truncNotch_repos |
| Upregulated in class | absentNotch |
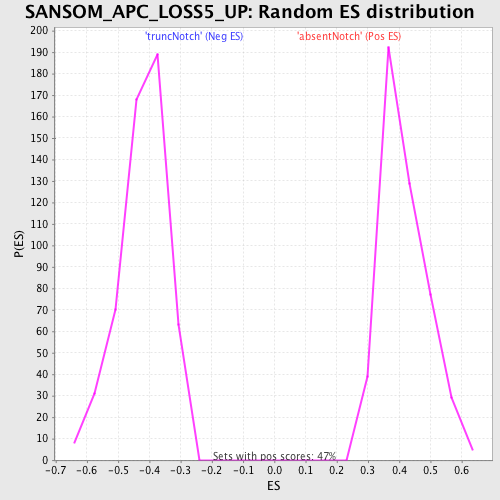
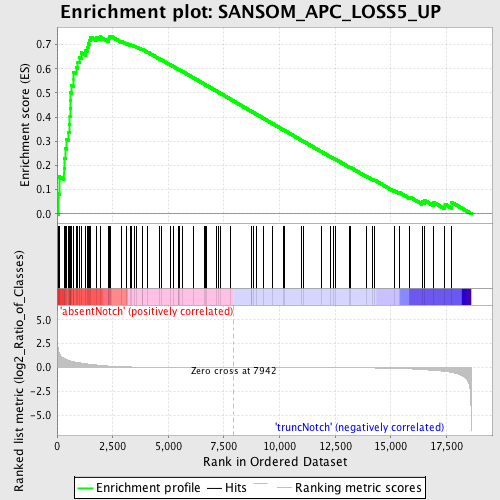
| GeneSet | SANSOM_APC_LOSS5_UP |
| Enrichment Score (ES) | 0.7351019 |
| Normalized Enrichment Score (NES) | 1.7732646 |
| Nominal p-value | 0.0 |
| FDR q-value | 0.03170403 |
| FWER p-Value | 0.027 |
| PROBE | DESCRIPTION (from dataset) | GENE SYMBOL | GENE_TITLE | RANK IN GENE LIST | RANK METRIC SCORE | RUNNING ES | CORE ENRICHMENT | |
|---|---|---|---|---|---|---|---|---|
| 1 | GNL3 | 4050338 4810500 | 55 | 1.783 | 0.0831 | Yes | ||
| 2 | EIF4G2 | 3800575 6860184 | 94 | 1.497 | 0.1532 | Yes | ||
| 3 | DDX21 | 6100446 | 309 | 0.946 | 0.1873 | Yes | ||
| 4 | 2810037C14RIK | 5290575 | 332 | 0.923 | 0.2307 | Yes | ||
| 5 | PRKRIR | 2370402 | 389 | 0.856 | 0.2690 | Yes | ||
| 6 | ETF1 | 6770075 | 439 | 0.816 | 0.3057 | Yes | ||
| 7 | NOL5 | 580731 | 524 | 0.744 | 0.3370 | Yes | ||
| 8 | NCL | 2360463 4540279 | 556 | 0.718 | 0.3700 | Yes | ||
| 9 | CDCA7 | 3060097 | 577 | 0.705 | 0.4029 | Yes | ||
| 10 | HK2 | 2640722 | 588 | 0.700 | 0.4362 | Yes | ||
| 11 | EIF1 | 5080100 | 598 | 0.690 | 0.4690 | Yes | ||
| 12 | ETS2 | 360451 | 605 | 0.686 | 0.5018 | Yes | ||
| 13 | TIAM1 | 5420288 | 659 | 0.655 | 0.5305 | Yes | ||
| 14 | FTSJ3 | 3140100 | 738 | 0.613 | 0.5559 | Yes | ||
| 15 | HNRPAB | 540504 | 740 | 0.612 | 0.5854 | Yes | ||
| 16 | SOX4 | 2260091 | 850 | 0.562 | 0.6067 | Yes | ||
| 17 | NSUN2 | 2120193 | 931 | 0.529 | 0.6278 | Yes | ||
| 18 | 4930573I19RIK | 5270402 | 1002 | 0.502 | 0.6483 | Yes | ||
| 19 | 1190002H23RIK | 4480128 | 1090 | 0.463 | 0.6659 | Yes | ||
| 20 | FEM1B | 1230110 | 1272 | 0.400 | 0.6755 | Yes | ||
| 21 | COPS2 | 3060142 | 1346 | 0.374 | 0.6896 | Yes | ||
| 22 | PES1 | 2470427 | 1410 | 0.357 | 0.7034 | Yes | ||
| 23 | UTP14A | 6590048 | 1460 | 0.345 | 0.7174 | Yes | ||
| 24 | CIRH1A | 2340372 | 1504 | 0.334 | 0.7312 | Yes | ||
| 25 | GNL2 | 6620022 | 1773 | 0.263 | 0.7295 | Yes | ||
| 26 | PRIM2A | 7000692 | 1931 | 0.226 | 0.7319 | Yes | ||
| 27 | SRR | 1190465 3800494 | 2307 | 0.155 | 0.7192 | Yes | ||
| 28 | ZFP90 | 580121 | 2331 | 0.151 | 0.7252 | Yes | ||
| 29 | RNF4 | 580286 1400152 | 2345 | 0.149 | 0.7317 | Yes | ||
| 30 | MAP4K4 | 2360059 | 2409 | 0.141 | 0.7351 | Yes | ||
| 31 | IFIT2 | 4810735 | 2875 | 0.091 | 0.7144 | No | ||
| 32 | CD24 | 1780091 | 3102 | 0.073 | 0.7057 | No | ||
| 33 | FUSIP1 | 520082 5390114 | 3280 | 0.061 | 0.6991 | No | ||
| 34 | TXNL4A | 4120286 6510242 | 3360 | 0.057 | 0.6976 | No | ||
| 35 | MYC | 380541 4670170 | 3486 | 0.050 | 0.6933 | No | ||
| 36 | ZRF1 | 6020181 6510484 | 3589 | 0.045 | 0.6899 | No | ||
| 37 | RIN2 | 2450184 | 3815 | 0.035 | 0.6795 | No | ||
| 38 | ORC2L | 1990470 6510019 | 3821 | 0.035 | 0.6809 | No | ||
| 39 | OLFR91 | 6290020 | 4069 | 0.026 | 0.6688 | No | ||
| 40 | FOXA2 | 540338 5860441 | 4599 | 0.016 | 0.6411 | No | ||
| 41 | LAMC2 | 450692 2680041 4200059 4670148 | 4671 | 0.015 | 0.6380 | No | ||
| 42 | NUP54 | 940546 2360156 4060278 | 5079 | 0.011 | 0.6166 | No | ||
| 43 | SEMA3C | 7000020 | 5242 | 0.010 | 0.6083 | No | ||
| 44 | EPHB3 | 6650341 | 5446 | 0.009 | 0.5977 | No | ||
| 45 | RNF149 | 5270494 | 5449 | 0.009 | 0.5980 | No | ||
| 46 | BTC | 3190133 | 5506 | 0.008 | 0.5954 | No | ||
| 47 | KIF5A | 510435 | 5621 | 0.008 | 0.5896 | No | ||
| 48 | SYNCRIP | 1690195 3140113 4670279 | 6127 | 0.005 | 0.5627 | No | ||
| 49 | PKP1 | 1500433 | 6645 | 0.004 | 0.5349 | No | ||
| 50 | CITED1 | 2350670 | 6691 | 0.003 | 0.5327 | No | ||
| 51 | PTBP2 | 1240398 | 6732 | 0.003 | 0.5307 | No | ||
| 52 | ZFP97 | 520324 | 7157 | 0.002 | 0.5079 | No | ||
| 53 | REPS1 | 2320603 2510333 | 7253 | 0.002 | 0.5029 | No | ||
| 54 | 9630050M13RIK | 2370086 | 7322 | 0.002 | 0.4993 | No | ||
| 55 | PLA2G12A | 1740463 4010066 4050348 | 7795 | 0.000 | 0.4738 | No | ||
| 56 | ADAM8 | 450347 5670609 | 8737 | -0.002 | 0.4231 | No | ||
| 57 | FAM60A | 3940092 | 8749 | -0.002 | 0.4226 | No | ||
| 58 | TSPAN12 | 4120010 | 8814 | -0.002 | 0.4193 | No | ||
| 59 | 1110014J01RIK | 1980332 | 8949 | -0.002 | 0.4122 | No | ||
| 60 | TGFBR1 | 1400148 4280020 6550711 | 9263 | -0.003 | 0.3955 | No | ||
| 61 | HELLS | 4560086 4810025 | 9667 | -0.004 | 0.3739 | No | ||
| 62 | MYO1B | 770372 | 10156 | -0.006 | 0.3479 | No | ||
| 63 | ANP32B | 940095 2450494 4200368 | 10200 | -0.006 | 0.3459 | No | ||
| 64 | FGFR4 | 2650072 | 10987 | -0.009 | 0.3039 | No | ||
| 65 | 2300002G24RIK | 2320040 | 11091 | -0.009 | 0.2988 | No | ||
| 66 | MMP7 | 1780497 | 11887 | -0.013 | 0.2565 | No | ||
| 67 | KIF20A | 2650050 | 12283 | -0.016 | 0.2360 | No | ||
| 68 | CEBPZ | 2970053 2680068 | 12427 | -0.017 | 0.2291 | No | ||
| 69 | PLA2G2A | 3190458 | 12494 | -0.018 | 0.2264 | No | ||
| 70 | HDC | 4150463 | 13161 | -0.025 | 0.1917 | No | ||
| 71 | ZZZ3 | 780133 2320239 2640452 5080706 6550341 | 13170 | -0.025 | 0.1924 | No | ||
| 72 | KCND2 | 1170128 2100112 | 13905 | -0.037 | 0.1546 | No | ||
| 73 | CD44 | 3990072 4850671 5860411 6860148 7050551 | 14177 | -0.044 | 0.1421 | No | ||
| 74 | TNFRSF19 | 3870731 6940730 | 14277 | -0.046 | 0.1390 | No | ||
| 75 | MDFI | 6200041 | 15168 | -0.081 | 0.0949 | No | ||
| 76 | DDIT4 | 2570408 | 15400 | -0.095 | 0.0870 | No | ||
| 77 | KCNQ1 | 1580050 6860441 | 15860 | -0.139 | 0.0690 | No | ||
| 78 | ZBTB17 | 6220082 | 16401 | -0.215 | 0.0502 | No | ||
| 79 | CDK9 | 630707 | 16522 | -0.231 | 0.0549 | No | ||
| 80 | SMYD5 | 6220025 | 16910 | -0.293 | 0.0481 | No | ||
| 81 | SLC27A1 | 6110093 | 17434 | -0.406 | 0.0395 | No | ||
| 82 | GRWD1 | 6350528 | 17731 | -0.502 | 0.0477 | No |