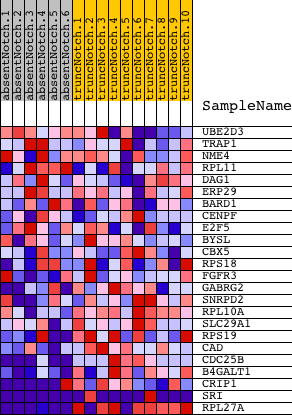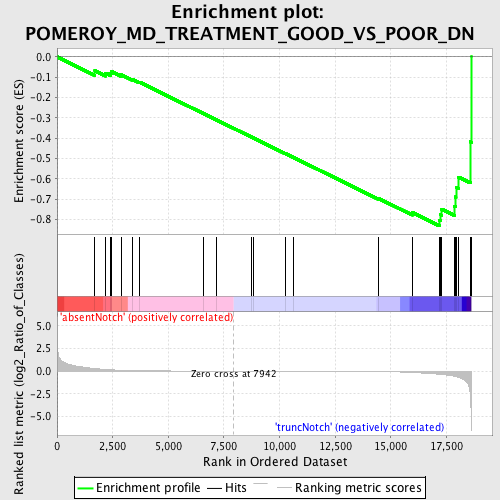
Profile of the Running ES Score & Positions of GeneSet Members on the Rank Ordered List
| Dataset | Set_03_absentNotch_versus_truncNotch.phenotype_absentNotch_versus_truncNotch.cls #absentNotch_versus_truncNotch.phenotype_absentNotch_versus_truncNotch.cls #absentNotch_versus_truncNotch_repos |
| Phenotype | phenotype_absentNotch_versus_truncNotch.cls#absentNotch_versus_truncNotch_repos |
| Upregulated in class | truncNotch |
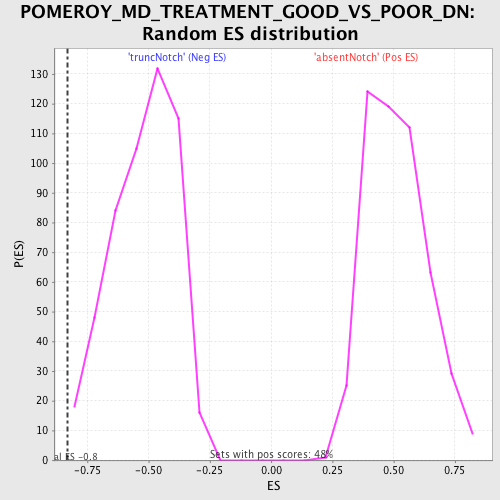
| GeneSet | POMEROY_MD_TREATMENT_GOOD_VS_POOR_DN |
| Enrichment Score (ES) | -0.83092946 |
| Normalized Enrichment Score (NES) | -1.6025904 |
| Nominal p-value | 0.0077220076 |
| FDR q-value | 0.6589182 |
| FWER p-Value | 0.911 |
| PROBE | DESCRIPTION (from dataset) | GENE SYMBOL | GENE_TITLE | RANK IN GENE LIST | RANK METRIC SCORE | RUNNING ES | CORE ENRICHMENT | |
|---|---|---|---|---|---|---|---|---|
| 1 | UBE2D3 | 3190452 | 1699 | 0.280 | -0.0687 | No | ||
| 2 | TRAP1 | 6040168 | 2174 | 0.177 | -0.0798 | No | ||
| 3 | NME4 | 3140736 5900446 | 2398 | 0.143 | -0.0802 | No | ||
| 4 | RPL11 | 3780435 | 2445 | 0.136 | -0.0716 | No | ||
| 5 | DAG1 | 460053 610341 | 2876 | 0.091 | -0.0874 | No | ||
| 6 | ERP29 | 4050441 | 3410 | 0.054 | -0.1117 | No | ||
| 7 | BARD1 | 3170348 | 3707 | 0.039 | -0.1245 | No | ||
| 8 | CENPF | 5050088 | 6573 | 0.004 | -0.2782 | No | ||
| 9 | E2F5 | 5860575 | 7165 | 0.002 | -0.3099 | No | ||
| 10 | BYSL | 3170110 | 8735 | -0.002 | -0.3941 | No | ||
| 11 | CBX5 | 3830072 6290167 | 8831 | -0.002 | -0.3990 | No | ||
| 12 | RPS18 | 670132 1230148 2030722 | 10245 | -0.006 | -0.4745 | No | ||
| 13 | FGFR3 | 5390632 6020021 | 10639 | -0.008 | -0.4950 | No | ||
| 14 | GABRG2 | 2350402 4210204 6130279 6550037 | 14460 | -0.051 | -0.6963 | No | ||
| 15 | SNRPD2 | 6110035 | 15964 | -0.153 | -0.7647 | No | ||
| 16 | RPL10A | 4850066 | 17196 | -0.348 | -0.8027 | Yes | ||
| 17 | SLC29A1 | 2970379 | 17232 | -0.354 | -0.7758 | Yes | ||
| 18 | RPS19 | 5860066 | 17288 | -0.369 | -0.7489 | Yes | ||
| 19 | CAD | 2340717 | 17860 | -0.566 | -0.7336 | Yes | ||
| 20 | CDC25B | 6940102 | 17909 | -0.592 | -0.6882 | Yes | ||
| 21 | B4GALT1 | 6980167 | 17930 | -0.602 | -0.6405 | Yes | ||
| 22 | CRIP1 | 4590377 | 18051 | -0.687 | -0.5911 | Yes | ||
| 23 | SRI | 3390446 4850064 | 18576 | -2.493 | -0.4170 | Yes | ||
| 24 | RPL27A | 3130451 110195 6840494 | 18614 | -5.164 | 0.0001 | Yes |