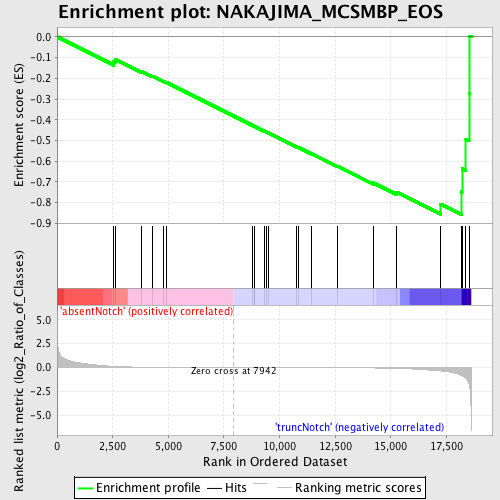
Profile of the Running ES Score & Positions of GeneSet Members on the Rank Ordered List
| Dataset | Set_03_absentNotch_versus_truncNotch.phenotype_absentNotch_versus_truncNotch.cls #absentNotch_versus_truncNotch.phenotype_absentNotch_versus_truncNotch.cls #absentNotch_versus_truncNotch_repos |
| Phenotype | phenotype_absentNotch_versus_truncNotch.cls#absentNotch_versus_truncNotch_repos |
| Upregulated in class | truncNotch |
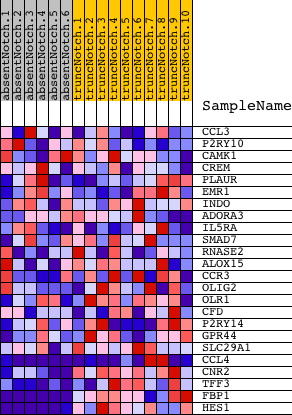
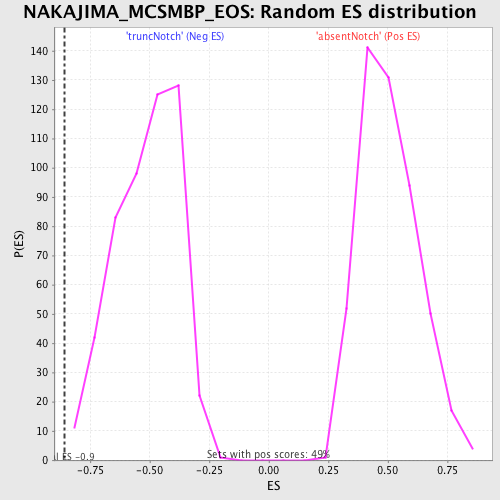
| GeneSet | NAKAJIMA_MCSMBP_EOS |
| Enrichment Score (ES) | -0.8571867 |
| Normalized Enrichment Score (NES) | -1.6843772 |
| Nominal p-value | 0.0019607844 |
| FDR q-value | 0.30018362 |
| FWER p-Value | 0.304 |
| PROBE | DESCRIPTION (from dataset) | GENE SYMBOL | GENE_TITLE | RANK IN GENE LIST | RANK METRIC SCORE | RUNNING ES | CORE ENRICHMENT | |
|---|---|---|---|---|---|---|---|---|
| 1 | CCL3 | 2810092 | 2546 | 0.123 | -0.1202 | No | ||
| 2 | P2RY10 | 6370039 6840204 | 2616 | 0.117 | -0.1080 | No | ||
| 3 | CAMK1 | 3390427 5220086 6940504 | 3788 | 0.036 | -0.1661 | No | ||
| 4 | CREM | 840156 6380438 6660041 6660168 | 4275 | 0.021 | -0.1893 | No | ||
| 5 | PLAUR | 5910280 | 4787 | 0.014 | -0.2149 | No | ||
| 6 | EMR1 | 70136 1500592 | 4921 | 0.012 | -0.2204 | No | ||
| 7 | INDO | 2680390 | 8786 | -0.002 | -0.4279 | No | ||
| 8 | ADORA3 | 630333 | 8850 | -0.002 | -0.4310 | No | ||
| 9 | IL5RA | 4540091 | 8869 | -0.002 | -0.4316 | No | ||
| 10 | SMAD7 | 430377 | 9309 | -0.003 | -0.4548 | No | ||
| 11 | RNASE2 | 3290563 | 9415 | -0.004 | -0.4599 | No | ||
| 12 | ALOX15 | 6620333 | 9500 | -0.004 | -0.4639 | No | ||
| 13 | CCR3 | 50427 | 10780 | -0.008 | -0.5316 | No | ||
| 14 | OLIG2 | 6660402 | 10836 | -0.008 | -0.5334 | No | ||
| 15 | OLR1 | 50025 3840484 | 11452 | -0.011 | -0.5650 | No | ||
| 16 | CFD | 2320736 | 12592 | -0.019 | -0.6237 | No | ||
| 17 | P2RY14 | 6100497 | 14215 | -0.045 | -0.7049 | No | ||
| 18 | GPR44 | 4050452 | 15254 | -0.086 | -0.7490 | No | ||
| 19 | SLC29A1 | 2970379 | 17232 | -0.354 | -0.8071 | Yes | ||
| 20 | CCL4 | 50368 430047 | 18164 | -0.801 | -0.7482 | Yes | ||
| 21 | CNR2 | 2760398 | 18201 | -0.835 | -0.6364 | Yes | ||
| 22 | TFF3 | 1580129 | 18376 | -1.106 | -0.4951 | Yes | ||
| 23 | FBP1 | 1470762 | 18514 | -1.688 | -0.2726 | Yes | ||
| 24 | HES1 | 4810280 | 18547 | -2.042 | 0.0037 | Yes |