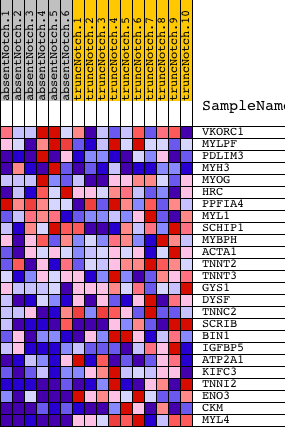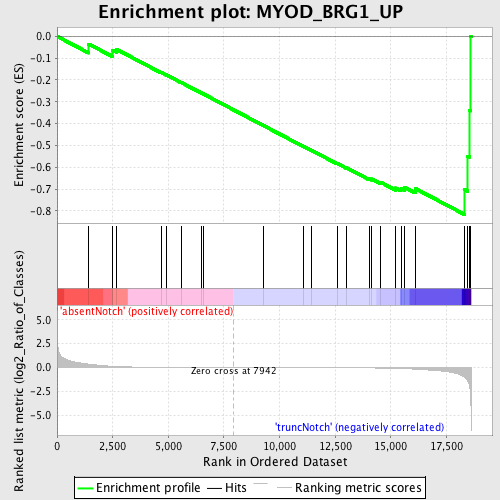
Profile of the Running ES Score & Positions of GeneSet Members on the Rank Ordered List
| Dataset | Set_03_absentNotch_versus_truncNotch.phenotype_absentNotch_versus_truncNotch.cls #absentNotch_versus_truncNotch.phenotype_absentNotch_versus_truncNotch.cls #absentNotch_versus_truncNotch_repos |
| Phenotype | phenotype_absentNotch_versus_truncNotch.cls#absentNotch_versus_truncNotch_repos |
| Upregulated in class | truncNotch |
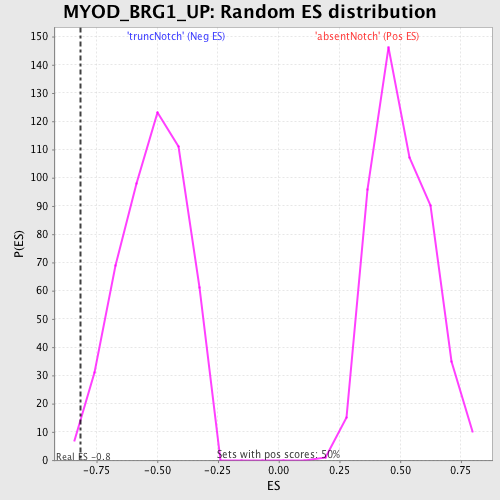
| GeneSet | MYOD_BRG1_UP |
| Enrichment Score (ES) | -0.816679 |
| Normalized Enrichment Score (NES) | -1.568791 |
| Nominal p-value | 0.0060 |
| FDR q-value | 0.40459257 |
| FWER p-Value | 0.985 |
| PROBE | DESCRIPTION (from dataset) | GENE SYMBOL | GENE_TITLE | RANK IN GENE LIST | RANK METRIC SCORE | RUNNING ES | CORE ENRICHMENT | |
|---|---|---|---|---|---|---|---|---|
| 1 | VKORC1 | 2370364 4210195 | 1419 | 0.354 | -0.0351 | No | ||
| 2 | MYLPF | 6110092 | 2493 | 0.128 | -0.0778 | No | ||
| 3 | PDLIM3 | 1410095 | 2494 | 0.128 | -0.0629 | No | ||
| 4 | MYH3 | 110400 | 2670 | 0.110 | -0.0595 | No | ||
| 5 | MYOG | 3190672 | 4678 | 0.015 | -0.1656 | No | ||
| 6 | HRC | 2690563 | 4894 | 0.013 | -0.1757 | No | ||
| 7 | PPFIA4 | 630446 | 5568 | 0.008 | -0.2110 | No | ||
| 8 | MYL1 | 2450707 | 6511 | 0.004 | -0.2612 | No | ||
| 9 | SCHIP1 | 4560152 | 6563 | 0.004 | -0.2635 | No | ||
| 10 | MYBPH | 2190711 | 9262 | -0.003 | -0.4082 | No | ||
| 11 | ACTA1 | 840538 | 11064 | -0.009 | -0.5040 | No | ||
| 12 | TNNT2 | 2450364 | 11445 | -0.011 | -0.5232 | No | ||
| 13 | TNNT3 | 1570239 | 12588 | -0.019 | -0.5825 | No | ||
| 14 | GYS1 | 540154 | 12996 | -0.023 | -0.6017 | No | ||
| 15 | DYSF | 4670411 | 14053 | -0.040 | -0.6538 | No | ||
| 16 | TNNC2 | 3840079 | 14146 | -0.043 | -0.6538 | No | ||
| 17 | SCRIB | 3060593 6130273 | 14524 | -0.053 | -0.6679 | No | ||
| 18 | BIN1 | 5420348 5670500 | 15213 | -0.084 | -0.6951 | No | ||
| 19 | IGFBP5 | 2360592 | 15461 | -0.100 | -0.6968 | No | ||
| 20 | ATP2A1 | 110309 | 15626 | -0.115 | -0.6922 | No | ||
| 21 | KIFC3 | 1340593 | 16102 | -0.171 | -0.6978 | No | ||
| 22 | TNNI2 | 5910739 | 18313 | -0.985 | -0.7018 | Yes | ||
| 23 | ENO3 | 5270136 | 18458 | -1.372 | -0.5496 | Yes | ||
| 24 | CKM | 1450524 | 18529 | -1.841 | -0.3387 | Yes | ||
| 25 | MYL4 | 6860288 | 18595 | -2.946 | 0.0011 | Yes |