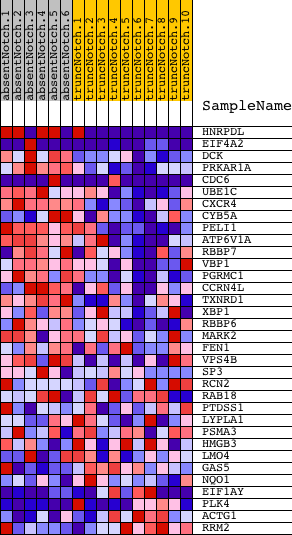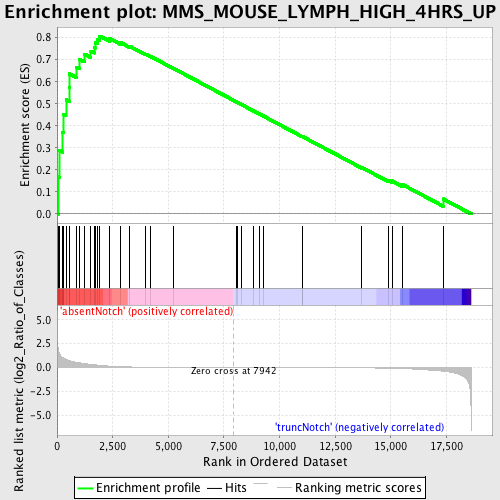
Profile of the Running ES Score & Positions of GeneSet Members on the Rank Ordered List
| Dataset | Set_03_absentNotch_versus_truncNotch.phenotype_absentNotch_versus_truncNotch.cls #absentNotch_versus_truncNotch.phenotype_absentNotch_versus_truncNotch.cls #absentNotch_versus_truncNotch_repos |
| Phenotype | phenotype_absentNotch_versus_truncNotch.cls#absentNotch_versus_truncNotch_repos |
| Upregulated in class | absentNotch |
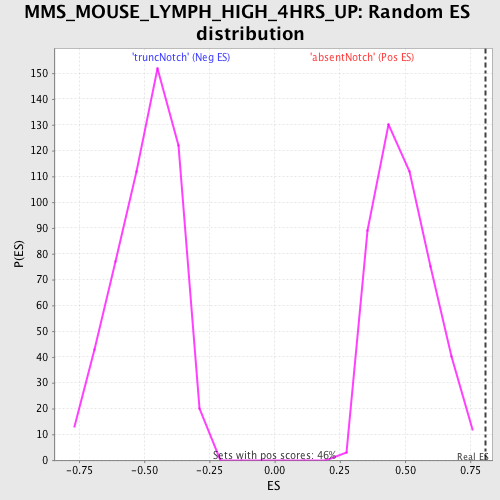
| GeneSet | MMS_MOUSE_LYMPH_HIGH_4HRS_UP |
| Enrichment Score (ES) | 0.8070146 |
| Normalized Enrichment Score (NES) | 1.6317824 |
| Nominal p-value | 0.0 |
| FDR q-value | 0.079023235 |
| FWER p-Value | 0.706 |
| PROBE | DESCRIPTION (from dataset) | GENE SYMBOL | GENE_TITLE | RANK IN GENE LIST | RANK METRIC SCORE | RUNNING ES | CORE ENRICHMENT | |
|---|---|---|---|---|---|---|---|---|
| 1 | HNRPDL | 1050102 1090181 5360471 | 44 | 2.002 | 0.1694 | Yes | ||
| 2 | EIF4A2 | 1170494 1740711 2850504 | 110 | 1.416 | 0.2873 | Yes | ||
| 3 | DCK | 6900411 | 231 | 1.060 | 0.3718 | Yes | ||
| 4 | PRKAR1A | 3450369 | 290 | 0.974 | 0.4522 | Yes | ||
| 5 | CDC6 | 4570296 5360600 | 400 | 0.848 | 0.5191 | Yes | ||
| 6 | UBE1C | 6040341 | 540 | 0.735 | 0.5746 | Yes | ||
| 7 | CXCR4 | 4590519 | 553 | 0.720 | 0.6357 | Yes | ||
| 8 | CYB5A | 5080450 | 877 | 0.552 | 0.6657 | Yes | ||
| 9 | PELI1 | 3870215 6900040 | 1008 | 0.499 | 0.7015 | Yes | ||
| 10 | ATP6V1A | 6590242 | 1228 | 0.416 | 0.7253 | Yes | ||
| 11 | RBBP7 | 430113 450450 2370309 | 1520 | 0.331 | 0.7381 | Yes | ||
| 12 | VBP1 | 4070050 | 1665 | 0.289 | 0.7551 | Yes | ||
| 13 | PGRMC1 | 4150692 | 1707 | 0.278 | 0.7768 | Yes | ||
| 14 | CCRN4L | 50438 5130372 | 1809 | 0.255 | 0.7932 | Yes | ||
| 15 | TXNRD1 | 6590446 | 1920 | 0.230 | 0.8070 | Yes | ||
| 16 | XBP1 | 3840594 | 2353 | 0.148 | 0.7965 | No | ||
| 17 | RBBP6 | 2320129 | 2864 | 0.092 | 0.7769 | No | ||
| 18 | MARK2 | 7210608 | 3255 | 0.064 | 0.7614 | No | ||
| 19 | FEN1 | 1770541 | 3976 | 0.029 | 0.7252 | No | ||
| 20 | VPS4B | 3440332 | 4205 | 0.023 | 0.7149 | No | ||
| 21 | SP3 | 3840338 | 5233 | 0.010 | 0.6604 | No | ||
| 22 | RCN2 | 840324 | 8060 | -0.000 | 0.5084 | No | ||
| 23 | RAB18 | 3120575 4590577 | 8119 | -0.000 | 0.5053 | No | ||
| 24 | PTDSS1 | 6020215 | 8303 | -0.001 | 0.4955 | No | ||
| 25 | LYPLA1 | 4480373 5570551 | 8812 | -0.002 | 0.4684 | No | ||
| 26 | PSMA3 | 5900047 7040161 | 9077 | -0.003 | 0.4544 | No | ||
| 27 | HMGB3 | 2940168 | 9256 | -0.003 | 0.4451 | No | ||
| 28 | LMO4 | 3800746 | 11010 | -0.009 | 0.3515 | No | ||
| 29 | GAS5 | 1980136 4210551 | 11021 | -0.009 | 0.3518 | No | ||
| 30 | NQO1 | 3450136 6840121 | 13696 | -0.034 | 0.2107 | No | ||
| 31 | EIF1AY | 1230541 6130301 | 14881 | -0.066 | 0.1527 | No | ||
| 32 | PLK4 | 430162 5720110 | 15052 | -0.075 | 0.1499 | No | ||
| 33 | ACTG1 | 540215 | 15514 | -0.104 | 0.1340 | No | ||
| 34 | RRM2 | 6350059 6940162 | 17351 | -0.383 | 0.0681 | No |