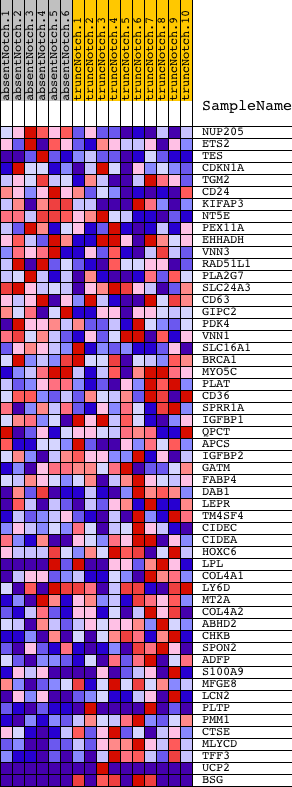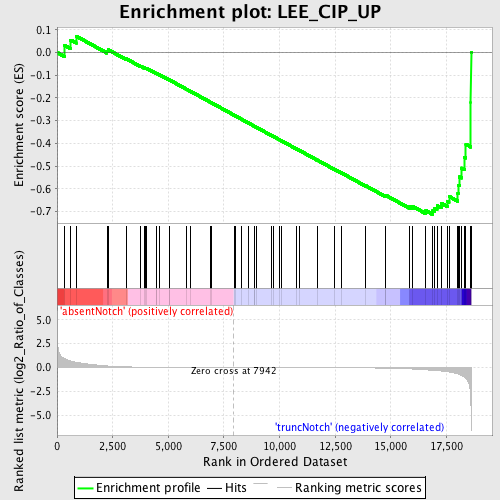
Profile of the Running ES Score & Positions of GeneSet Members on the Rank Ordered List
| Dataset | Set_03_absentNotch_versus_truncNotch.phenotype_absentNotch_versus_truncNotch.cls #absentNotch_versus_truncNotch.phenotype_absentNotch_versus_truncNotch.cls #absentNotch_versus_truncNotch_repos |
| Phenotype | phenotype_absentNotch_versus_truncNotch.cls#absentNotch_versus_truncNotch_repos |
| Upregulated in class | truncNotch |
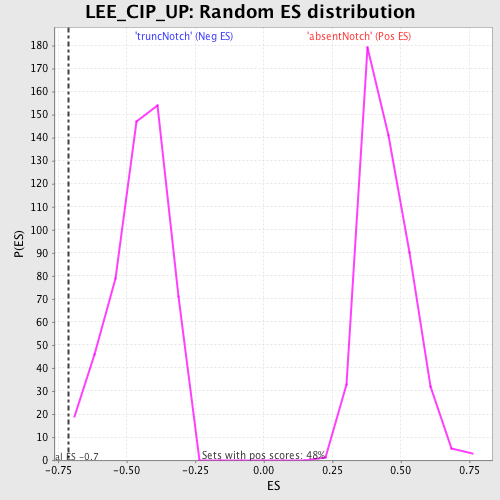
| GeneSet | LEE_CIP_UP |
| Enrichment Score (ES) | -0.7131363 |
| Normalized Enrichment Score (NES) | -1.5759686 |
| Nominal p-value | 0.003875969 |
| FDR q-value | 0.4004042 |
| FWER p-Value | 0.978 |
| PROBE | DESCRIPTION (from dataset) | GENE SYMBOL | GENE_TITLE | RANK IN GENE LIST | RANK METRIC SCORE | RUNNING ES | CORE ENRICHMENT | |
|---|---|---|---|---|---|---|---|---|
| 1 | NUP205 | 3830079 | 341 | 0.914 | 0.0315 | No | ||
| 2 | ETS2 | 360451 | 605 | 0.686 | 0.0548 | No | ||
| 3 | TES | 2680184 3840736 | 855 | 0.559 | 0.0720 | No | ||
| 4 | CDKN1A | 4050088 6400706 | 2242 | 0.164 | 0.0063 | No | ||
| 5 | TGM2 | 5360452 | 2296 | 0.157 | 0.0120 | No | ||
| 6 | CD24 | 1780091 | 3102 | 0.073 | -0.0274 | No | ||
| 7 | KIFAP3 | 3800524 4590082 6940075 | 3738 | 0.038 | -0.0596 | No | ||
| 8 | NT5E | 2030603 1400731 | 3919 | 0.031 | -0.0675 | No | ||
| 9 | PEX11A | 670021 2320195 | 3988 | 0.029 | -0.0696 | No | ||
| 10 | EHHADH | 6200315 | 4004 | 0.029 | -0.0689 | No | ||
| 11 | VNN3 | 730053 4610609 | 4459 | 0.018 | -0.0923 | No | ||
| 12 | RAD51L1 | 4010112 5860435 | 4460 | 0.018 | -0.0913 | No | ||
| 13 | PLA2G7 | 4730092 | 4618 | 0.016 | -0.0989 | No | ||
| 14 | SLC24A3 | 5080707 | 5037 | 0.011 | -0.1208 | No | ||
| 15 | CD63 | 6660451 | 5069 | 0.011 | -0.1219 | No | ||
| 16 | GIPC2 | 3800463 | 5835 | 0.007 | -0.1627 | No | ||
| 17 | PDK4 | 6400300 | 6003 | 0.006 | -0.1714 | No | ||
| 18 | VNN1 | 3940400 | 6896 | 0.003 | -0.2193 | No | ||
| 19 | SLC16A1 | 50433 | 6948 | 0.003 | -0.2219 | No | ||
| 20 | BRCA1 | 4780669 | 7993 | -0.000 | -0.2782 | No | ||
| 21 | MYO5C | 3850097 | 8002 | -0.000 | -0.2786 | No | ||
| 22 | PLAT | 6860128 | 8308 | -0.001 | -0.2950 | No | ||
| 23 | CD36 | 5890575 | 8618 | -0.002 | -0.3115 | No | ||
| 24 | SPRR1A | 3870064 | 8851 | -0.002 | -0.3239 | No | ||
| 25 | IGFBP1 | 5720435 | 8889 | -0.002 | -0.3258 | No | ||
| 26 | QPCT | 6180465 | 8939 | -0.002 | -0.3283 | No | ||
| 27 | APCS | 2060500 | 9617 | -0.004 | -0.3645 | No | ||
| 28 | IGFBP2 | 5220563 | 9713 | -0.005 | -0.3694 | No | ||
| 29 | GATM | 380671 | 9986 | -0.005 | -0.3837 | No | ||
| 30 | FABP4 | 5050114 | 10100 | -0.006 | -0.3895 | No | ||
| 31 | DAB1 | 2060193 7000605 | 10766 | -0.008 | -0.4249 | No | ||
| 32 | LEPR | 1340398 3190324 | 10879 | -0.008 | -0.4304 | No | ||
| 33 | TM4SF4 | 540600 | 11685 | -0.012 | -0.4732 | No | ||
| 34 | CIDEC | 3450372 | 12451 | -0.017 | -0.5134 | No | ||
| 35 | CIDEA | 4560020 | 12775 | -0.020 | -0.5297 | No | ||
| 36 | HOXC6 | 3850133 4920736 | 13874 | -0.036 | -0.5869 | No | ||
| 37 | LPL | 1450735 2970706 | 14755 | -0.061 | -0.6309 | No | ||
| 38 | COL4A1 | 1740575 | 14758 | -0.061 | -0.6277 | No | ||
| 39 | LY6D | 4050010 | 15843 | -0.136 | -0.6787 | No | ||
| 40 | MT2A | 6860286 | 15980 | -0.156 | -0.6775 | No | ||
| 41 | COL4A2 | 2350619 | 16574 | -0.237 | -0.6965 | No | ||
| 42 | ABHD2 | 4850504 6840010 | 16884 | -0.287 | -0.6974 | Yes | ||
| 43 | CHKB | 770129 | 16953 | -0.300 | -0.6847 | Yes | ||
| 44 | SPON2 | 2680136 | 17077 | -0.322 | -0.6737 | Yes | ||
| 45 | ADFP | 1740102 | 17277 | -0.365 | -0.6645 | Yes | ||
| 46 | S100A9 | 7050528 | 17554 | -0.440 | -0.6554 | Yes | ||
| 47 | MFGE8 | 3440373 | 17615 | -0.462 | -0.6334 | Yes | ||
| 48 | LCN2 | 2510112 | 18012 | -0.648 | -0.6193 | Yes | ||
| 49 | PLTP | 630110 130497 4050139 | 18028 | -0.667 | -0.5837 | Yes | ||
| 50 | PMM1 | 6840112 | 18080 | -0.708 | -0.5478 | Yes | ||
| 51 | CTSE | 2030292 | 18172 | -0.809 | -0.5085 | Yes | ||
| 52 | MLYCD | 6760181 | 18322 | -1.000 | -0.4619 | Yes | ||
| 53 | TFF3 | 1580129 | 18376 | -1.106 | -0.4044 | Yes | ||
| 54 | UCP2 | 2190050 4070711 | 18600 | -3.605 | -0.2195 | Yes | ||
| 55 | BSG | 2900193 6520053 | 18603 | -4.035 | 0.0007 | Yes |