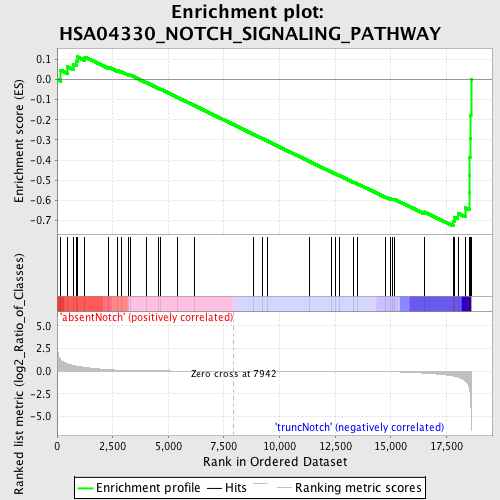
Profile of the Running ES Score & Positions of GeneSet Members on the Rank Ordered List
| Dataset | Set_03_absentNotch_versus_truncNotch.phenotype_absentNotch_versus_truncNotch.cls #absentNotch_versus_truncNotch.phenotype_absentNotch_versus_truncNotch.cls #absentNotch_versus_truncNotch_repos |
| Phenotype | phenotype_absentNotch_versus_truncNotch.cls#absentNotch_versus_truncNotch_repos |
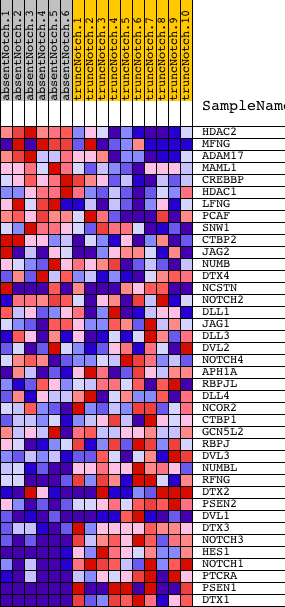
| Upregulated in class | truncNotch |
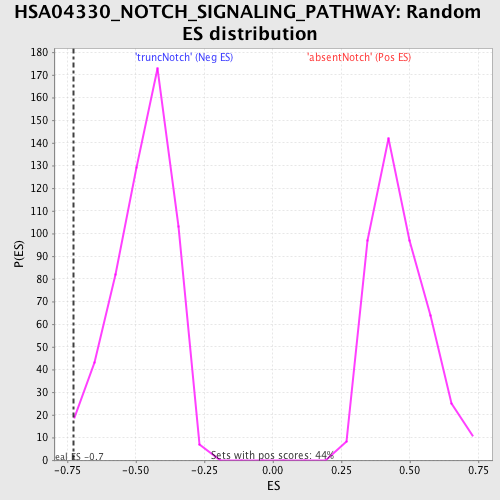
| GeneSet | HSA04330_NOTCH_SIGNALING_PATHWAY |
| Enrichment Score (ES) | -0.72721004 |
| Normalized Enrichment Score (NES) | -1.5360566 |
| Nominal p-value | 0.010791367 |
| FDR q-value | 0.4817069 |
| FWER p-Value | 0.999 |
| PROBE | DESCRIPTION (from dataset) | GENE SYMBOL | GENE_TITLE | RANK IN GENE LIST | RANK METRIC SCORE | RUNNING ES | CORE ENRICHMENT | |
|---|---|---|---|---|---|---|---|---|
| 1 | HDAC2 | 4050433 | 153 | 1.273 | 0.0460 | No | ||
| 2 | MFNG | 1770242 4280348 | 472 | 0.786 | 0.0623 | No | ||
| 3 | ADAM17 | 360292 | 717 | 0.625 | 0.0758 | No | ||
| 4 | MAML1 | 2760008 | 876 | 0.553 | 0.0908 | No | ||
| 5 | CREBBP | 5690035 7040050 | 909 | 0.541 | 0.1121 | No | ||
| 6 | HDAC1 | 2850670 | 1248 | 0.409 | 0.1113 | No | ||
| 7 | LFNG | 5360711 | 2316 | 0.154 | 0.0605 | No | ||
| 8 | PCAF | 2230161 2570369 6550451 | 2700 | 0.107 | 0.0444 | No | ||
| 9 | SNW1 | 4010736 | 2871 | 0.091 | 0.0391 | No | ||
| 10 | CTBP2 | 430309 3710079 | 3199 | 0.067 | 0.0244 | No | ||
| 11 | JAG2 | 1500341 | 3300 | 0.060 | 0.0216 | No | ||
| 12 | NUMB | 2450735 3800253 6350040 | 4025 | 0.028 | -0.0162 | No | ||
| 13 | DTX4 | 4120433 | 4574 | 0.017 | -0.0450 | No | ||
| 14 | NCSTN | 940601 6400594 | 4664 | 0.015 | -0.0492 | No | ||
| 15 | NOTCH2 | 2570397 | 5426 | 0.009 | -0.0898 | No | ||
| 16 | DLL1 | 1770377 | 6187 | 0.005 | -0.1304 | No | ||
| 17 | JAG1 | 3440390 | 8844 | -0.002 | -0.2733 | No | ||
| 18 | DLL3 | 4010093 | 9233 | -0.003 | -0.2941 | No | ||
| 19 | DVL2 | 6110162 | 9436 | -0.004 | -0.3048 | No | ||
| 20 | NOTCH4 | 2450040 6370707 | 11342 | -0.010 | -0.4069 | No | ||
| 21 | APH1A | 4060273 4670465 6450711 | 12343 | -0.017 | -0.4600 | No | ||
| 22 | RBPJL | 5390019 | 12498 | -0.018 | -0.4675 | No | ||
| 23 | DLL4 | 6400403 | 12673 | -0.019 | -0.4761 | No | ||
| 24 | NCOR2 | 1980575 6550050 | 13317 | -0.027 | -0.5096 | No | ||
| 25 | CTBP1 | 3780315 | 13517 | -0.030 | -0.5190 | No | ||
| 26 | GCN5L2 | 2340609 | 14766 | -0.061 | -0.5836 | No | ||
| 27 | RBPJ | 2360164 5550136 5720402 | 14993 | -0.071 | -0.5927 | No | ||
| 28 | DVL3 | 360156 5390075 | 15081 | -0.076 | -0.5941 | No | ||
| 29 | NUMBL | 6130360 6200333 | 15154 | -0.080 | -0.5946 | No | ||
| 30 | RFNG | 6290086 | 16509 | -0.229 | -0.6577 | No | ||
| 31 | DTX2 | 4210041 7000008 | 17801 | -0.534 | -0.7045 | Yes | ||
| 32 | PSEN2 | 130382 | 17846 | -0.558 | -0.6831 | Yes | ||
| 33 | DVL1 | 5900450 6510162 | 18019 | -0.658 | -0.6643 | Yes | ||
| 34 | DTX3 | 1690458 | 18348 | -1.048 | -0.6373 | Yes | ||
| 35 | NOTCH3 | 3060603 | 18544 | -2.010 | -0.5622 | Yes | ||
| 36 | HES1 | 4810280 | 18547 | -2.042 | -0.4754 | Yes | ||
| 37 | NOTCH1 | 3390114 | 18550 | -2.087 | -0.3866 | Yes | ||
| 38 | PTCRA | 6940142 | 18561 | -2.265 | -0.2907 | Yes | ||
| 39 | PSEN1 | 130403 2030647 6100603 | 18581 | -2.626 | -0.1799 | Yes | ||
| 40 | DTX1 | 5900372 | 18604 | -4.268 | 0.0006 | Yes |