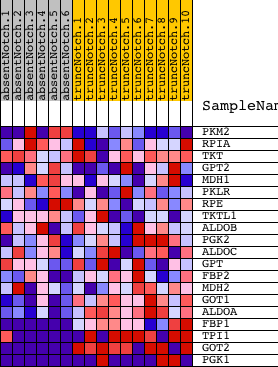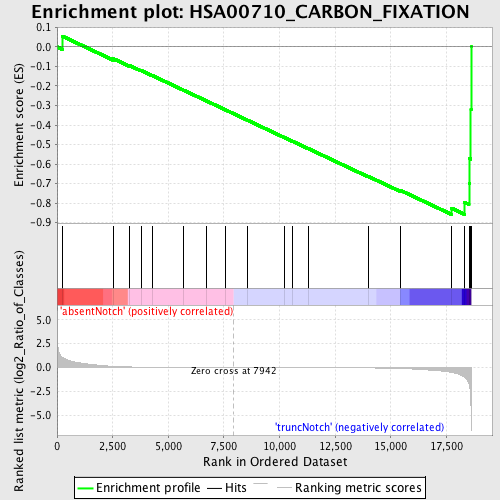
Profile of the Running ES Score & Positions of GeneSet Members on the Rank Ordered List
| Dataset | Set_03_absentNotch_versus_truncNotch.phenotype_absentNotch_versus_truncNotch.cls #absentNotch_versus_truncNotch.phenotype_absentNotch_versus_truncNotch.cls #absentNotch_versus_truncNotch_repos |
| Phenotype | phenotype_absentNotch_versus_truncNotch.cls#absentNotch_versus_truncNotch_repos |
| Upregulated in class | truncNotch |
| GeneSet | HSA00710_CARBON_FIXATION |
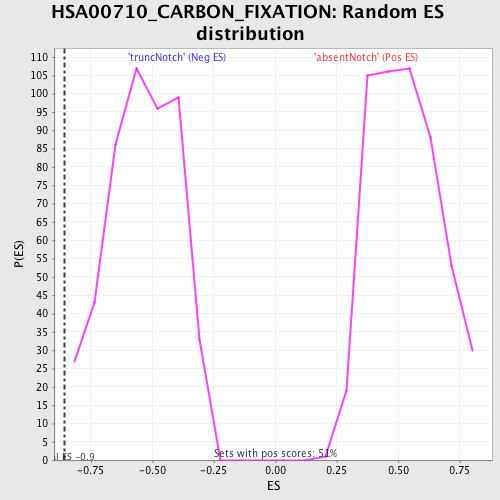
| Enrichment Score (ES) | -0.85843045 |
| Normalized Enrichment Score (NES) | -1.5874734 |
| Nominal p-value | 0.00203666 |
| FDR q-value | 0.44143334 |
| FWER p-Value | 0.959 |
| PROBE | DESCRIPTION (from dataset) | GENE SYMBOL | GENE_TITLE | RANK IN GENE LIST | RANK METRIC SCORE | RUNNING ES | CORE ENRICHMENT | |
|---|---|---|---|---|---|---|---|---|
| 1 | PKM2 | 6520403 70500 | 229 | 1.062 | 0.0554 | No | ||
| 2 | RPIA | 780079 | 2537 | 0.124 | -0.0608 | No | ||
| 3 | TKT | 6590064 6860039 | 3248 | 0.064 | -0.0949 | No | ||
| 4 | GPT2 | 1850463 | 3771 | 0.037 | -0.1206 | No | ||
| 5 | MDH1 | 6660358 6760731 | 4297 | 0.021 | -0.1475 | No | ||
| 6 | PKLR | 1170400 2470114 | 5677 | 0.007 | -0.2212 | No | ||
| 7 | RPE | 940114 | 6726 | 0.003 | -0.2773 | No | ||
| 8 | TKTL1 | 2810672 6760102 | 7568 | 0.001 | -0.3225 | No | ||
| 9 | ALDOB | 4730324 | 8552 | -0.001 | -0.3752 | No | ||
| 10 | PGK2 | 2650091 | 10207 | -0.006 | -0.4638 | No | ||
| 11 | ALDOC | 450121 610427 | 10575 | -0.007 | -0.4830 | No | ||
| 12 | GPT | 2350270 | 11299 | -0.010 | -0.5213 | No | ||
| 13 | FBP2 | 1580193 | 13986 | -0.039 | -0.6632 | No | ||
| 14 | MDH2 | 1850601 | 15423 | -0.097 | -0.7343 | No | ||
| 15 | GOT1 | 2940465 | 17733 | -0.503 | -0.8264 | Yes | ||
| 16 | ALDOA | 6290672 | 18304 | -0.964 | -0.7956 | Yes | ||
| 17 | FBP1 | 1470762 | 18514 | -1.688 | -0.6992 | Yes | ||
| 18 | TPI1 | 1500215 2100154 | 18546 | -2.022 | -0.5719 | Yes | ||
| 19 | GOT2 | 4570164 5220450 | 18602 | -4.022 | -0.3184 | Yes | ||
| 20 | PGK1 | 1570494 630300 | 18610 | -5.004 | 0.0003 | Yes |