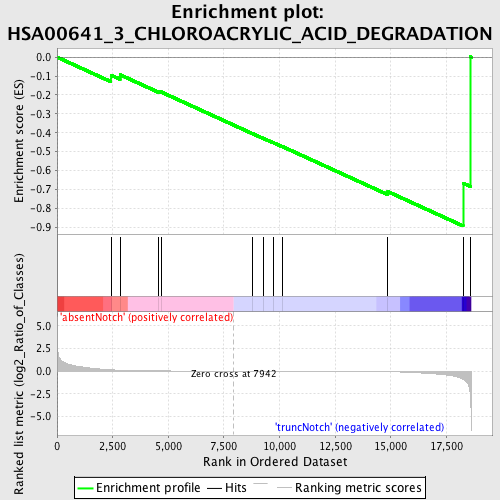
Profile of the Running ES Score & Positions of GeneSet Members on the Rank Ordered List
| Dataset | Set_03_absentNotch_versus_truncNotch.phenotype_absentNotch_versus_truncNotch.cls #absentNotch_versus_truncNotch.phenotype_absentNotch_versus_truncNotch.cls #absentNotch_versus_truncNotch_repos |
| Phenotype | phenotype_absentNotch_versus_truncNotch.cls#absentNotch_versus_truncNotch_repos |
| Upregulated in class | truncNotch |
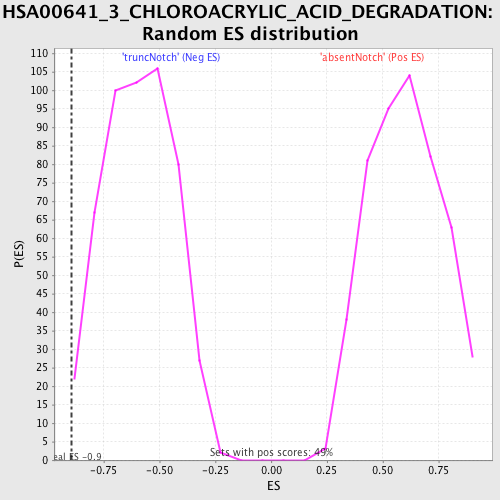
| GeneSet | HSA00641_3_CHLOROACRYLIC_ACID_DEGRADATION |
| Enrichment Score (ES) | -0.89309925 |
| Normalized Enrichment Score (NES) | -1.5095439 |
| Nominal p-value | 0.013833992 |
| FDR q-value | 0.5128527 |
| FWER p-Value | 1.0 |
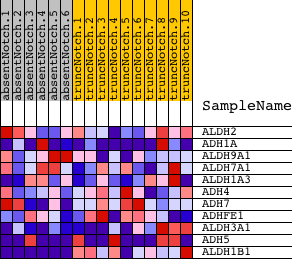
| PROBE | DESCRIPTION (from dataset) | GENE SYMBOL | GENE_TITLE | RANK IN GENE LIST | RANK METRIC SCORE | RUNNING ES | CORE ENRICHMENT | |
|---|---|---|---|---|---|---|---|---|
| 1 | ALDH2 | 4230019 | 2422 | 0.138 | -0.0954 | No | ||
| 2 | ADH1A | 3170427 | 2829 | 0.095 | -0.0932 | No | ||
| 3 | ALDH9A1 | 4810047 | 4563 | 0.017 | -0.1821 | No | ||
| 4 | ALDH7A1 | 4050446 | 4669 | 0.015 | -0.1839 | No | ||
| 5 | ALDH1A3 | 2100270 | 8773 | -0.002 | -0.4039 | No | ||
| 6 | ADH4 | 6840301 | 9274 | -0.003 | -0.4299 | No | ||
| 7 | ADH7 | 60465 | 9722 | -0.005 | -0.4528 | No | ||
| 8 | ADHFE1 | 1990673 6840022 | 10121 | -0.006 | -0.4727 | No | ||
| 9 | ALDH3A1 | 580095 | 14866 | -0.065 | -0.7114 | Yes | ||
| 10 | ADH5 | 6290100 6380711 | 18248 | -0.901 | -0.6666 | Yes | ||
| 11 | ALDH1B1 | 610195 | 18587 | -2.729 | 0.0016 | Yes |