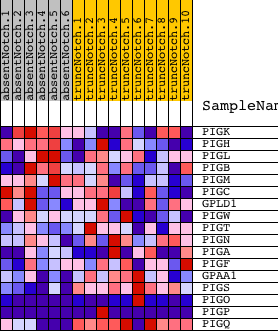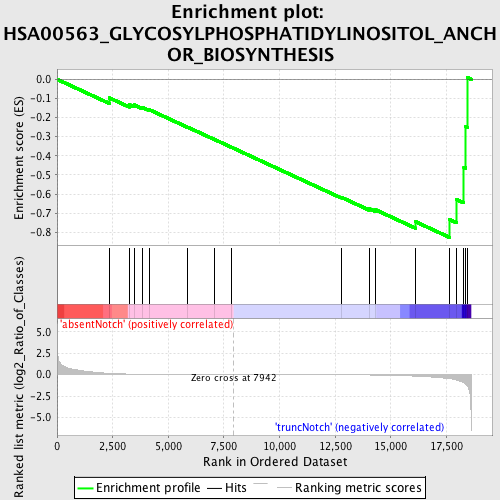
Profile of the Running ES Score & Positions of GeneSet Members on the Rank Ordered List
| Dataset | Set_03_absentNotch_versus_truncNotch.phenotype_absentNotch_versus_truncNotch.cls #absentNotch_versus_truncNotch.phenotype_absentNotch_versus_truncNotch.cls #absentNotch_versus_truncNotch_repos |
| Phenotype | phenotype_absentNotch_versus_truncNotch.cls#absentNotch_versus_truncNotch_repos |
| Upregulated in class | truncNotch |
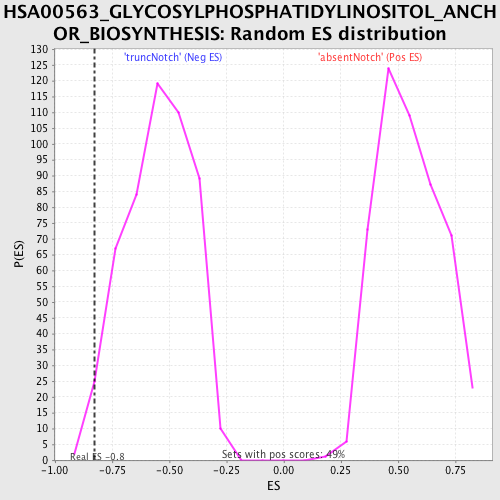
| GeneSet | HSA00563_GLYCOSYLPHOSPHATIDYLINOSITOL_ANCHOR_BIOSYNTHESIS |
| Enrichment Score (ES) | -0.82694685 |
| Normalized Enrichment Score (NES) | -1.5126714 |
| Nominal p-value | 0.019762846 |
| FDR q-value | 0.5211834 |
| FWER p-Value | 1.0 |
| PROBE | DESCRIPTION (from dataset) | GENE SYMBOL | GENE_TITLE | RANK IN GENE LIST | RANK METRIC SCORE | RUNNING ES | CORE ENRICHMENT | |
|---|---|---|---|---|---|---|---|---|
| 1 | PIGK | 4540193 6350324 6860736 | 2352 | 0.148 | -0.0971 | No | ||
| 2 | PIGH | 1500484 | 3243 | 0.064 | -0.1323 | No | ||
| 3 | PIGL | 4060497 | 3461 | 0.052 | -0.1338 | No | ||
| 4 | PIGB | 2850193 6380286 | 3828 | 0.034 | -0.1466 | No | ||
| 5 | PIGM | 2680377 | 4159 | 0.024 | -0.1596 | No | ||
| 6 | PIGC | 5690377 | 5867 | 0.006 | -0.2501 | No | ||
| 7 | GPLD1 | 6100121 6290154 | 7090 | 0.002 | -0.3153 | No | ||
| 8 | PIGW | 4810072 | 7844 | 0.000 | -0.3558 | No | ||
| 9 | PIGT | 2360180 6840019 | 12772 | -0.020 | -0.6166 | No | ||
| 10 | PIGN | 4210736 | 14027 | -0.040 | -0.6762 | No | ||
| 11 | PIGA | 1940435 5290692 | 14322 | -0.048 | -0.6826 | No | ||
| 12 | PIGF | 5690050 | 16115 | -0.172 | -0.7448 | Yes | ||
| 13 | GPAA1 | 1500463 | 17644 | -0.473 | -0.7334 | Yes | ||
| 14 | PIGS | 3610142 | 17956 | -0.614 | -0.6287 | Yes | ||
| 15 | PIGO | 1400528 2340026 5340097 | 18284 | -0.942 | -0.4599 | Yes | ||
| 16 | PIGP | 4280204 5890440 | 18369 | -1.102 | -0.2464 | Yes | ||
| 17 | PIGQ | 4540286 1450452 | 18446 | -1.312 | 0.0091 | Yes |