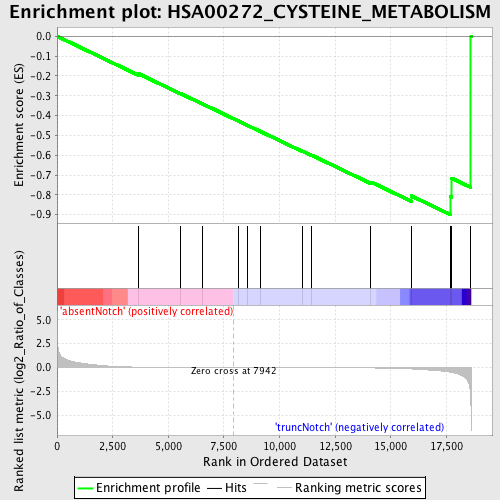
Profile of the Running ES Score & Positions of GeneSet Members on the Rank Ordered List
| Dataset | Set_03_absentNotch_versus_truncNotch.phenotype_absentNotch_versus_truncNotch.cls #absentNotch_versus_truncNotch.phenotype_absentNotch_versus_truncNotch.cls #absentNotch_versus_truncNotch_repos |
| Phenotype | phenotype_absentNotch_versus_truncNotch.cls#absentNotch_versus_truncNotch_repos |
| Upregulated in class | truncNotch |
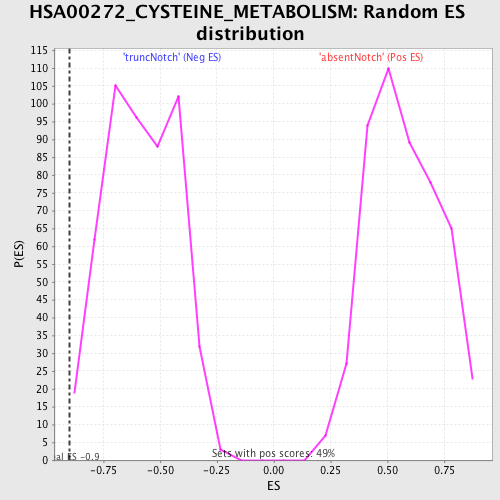
| GeneSet | HSA00272_CYSTEINE_METABOLISM |
| Enrichment Score (ES) | -0.89886034 |
| Normalized Enrichment Score (NES) | -1.5470376 |
| Nominal p-value | 0.00591716 |
| FDR q-value | 0.47665495 |
| FWER p-Value | 0.998 |
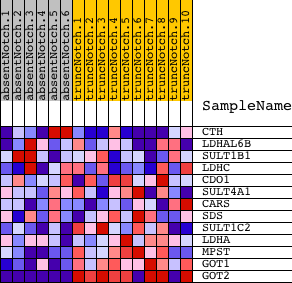
| PROBE | DESCRIPTION (from dataset) | GENE SYMBOL | GENE_TITLE | RANK IN GENE LIST | RANK METRIC SCORE | RUNNING ES | CORE ENRICHMENT | |
|---|---|---|---|---|---|---|---|---|
| 1 | CTH | 1190332 5290139 | 3670 | 0.041 | -0.1895 | No | ||
| 2 | LDHAL6B | 5130280 | 5526 | 0.008 | -0.2877 | No | ||
| 3 | SULT1B1 | 2230750 5700102 | 6548 | 0.004 | -0.3418 | No | ||
| 4 | LDHC | 2030458 6100463 | 8132 | -0.000 | -0.4268 | No | ||
| 5 | CDO1 | 2480279 | 8579 | -0.002 | -0.4505 | No | ||
| 6 | SULT4A1 | 5270161 | 9145 | -0.003 | -0.4803 | No | ||
| 7 | CARS | 460441 3140341 | 11033 | -0.009 | -0.5800 | No | ||
| 8 | SDS | 110242 6380725 | 11426 | -0.011 | -0.5990 | No | ||
| 9 | SULT1C2 | 1740348 5910538 | 14107 | -0.042 | -0.7352 | No | ||
| 10 | LDHA | 2190594 | 15920 | -0.145 | -0.8050 | No | ||
| 11 | MPST | 6380373 | 17668 | -0.481 | -0.8077 | Yes | ||
| 12 | GOT1 | 2940465 | 17733 | -0.503 | -0.7158 | Yes | ||
| 13 | GOT2 | 4570164 5220450 | 18602 | -4.022 | 0.0008 | Yes |