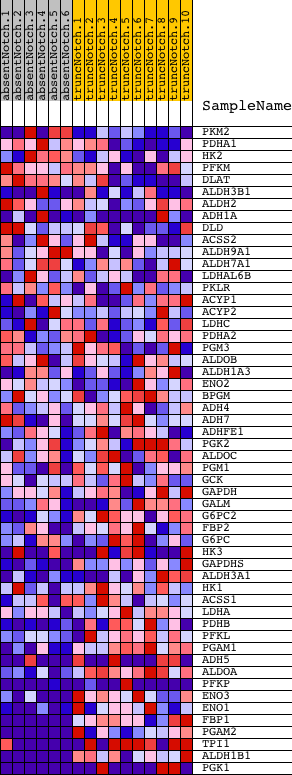
Profile of the Running ES Score & Positions of GeneSet Members on the Rank Ordered List
| Dataset | Set_03_absentNotch_versus_truncNotch.phenotype_absentNotch_versus_truncNotch.cls #absentNotch_versus_truncNotch.phenotype_absentNotch_versus_truncNotch.cls #absentNotch_versus_truncNotch_repos |
| Phenotype | phenotype_absentNotch_versus_truncNotch.cls#absentNotch_versus_truncNotch_repos |
| Upregulated in class | truncNotch |
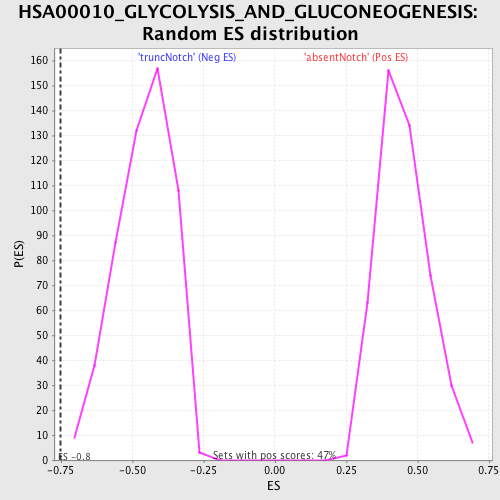
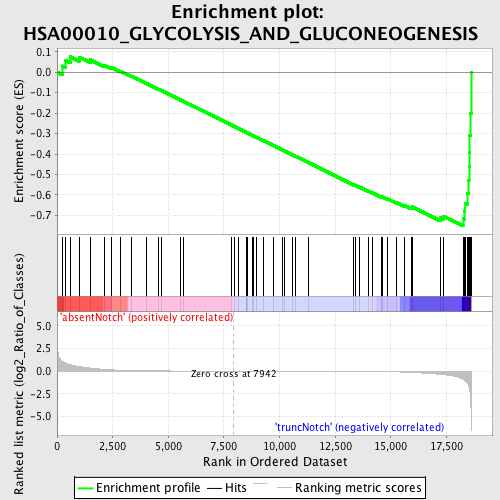
| GeneSet | HSA00010_GLYCOLYSIS_AND_GLUCONEOGENESIS |
| Enrichment Score (ES) | -0.751485 |
| Normalized Enrichment Score (NES) | -1.6423411 |
| Nominal p-value | 0.0 |
| FDR q-value | 0.419586 |
| FWER p-Value | 0.645 |
| PROBE | DESCRIPTION (from dataset) | GENE SYMBOL | GENE_TITLE | RANK IN GENE LIST | RANK METRIC SCORE | RUNNING ES | CORE ENRICHMENT | |
|---|---|---|---|---|---|---|---|---|
| 1 | PKM2 | 6520403 70500 | 229 | 1.062 | 0.0306 | No | ||
| 2 | PDHA1 | 5550397 | 371 | 0.879 | 0.0586 | No | ||
| 3 | HK2 | 2640722 | 588 | 0.700 | 0.0753 | No | ||
| 4 | PFKM | 1990156 5720168 | 991 | 0.504 | 0.0740 | No | ||
| 5 | DLAT | 430452 | 1488 | 0.338 | 0.0610 | No | ||
| 6 | ALDH3B1 | 4210010 6940403 | 2143 | 0.184 | 0.0332 | No | ||
| 7 | ALDH2 | 4230019 | 2422 | 0.138 | 0.0238 | No | ||
| 8 | ADH1A | 3170427 | 2829 | 0.095 | 0.0058 | No | ||
| 9 | DLD | 4150403 6590341 | 3362 | 0.057 | -0.0205 | No | ||
| 10 | ACSS2 | 1780435 3170224 | 4036 | 0.028 | -0.0557 | No | ||
| 11 | ALDH9A1 | 4810047 | 4563 | 0.017 | -0.0833 | No | ||
| 12 | ALDH7A1 | 4050446 | 4669 | 0.015 | -0.0884 | No | ||
| 13 | LDHAL6B | 5130280 | 5526 | 0.008 | -0.1342 | No | ||
| 14 | PKLR | 1170400 2470114 | 5677 | 0.007 | -0.1419 | No | ||
| 15 | ACYP1 | 6380403 | 7855 | 0.000 | -0.2592 | No | ||
| 16 | ACYP2 | 2510605 | 7970 | -0.000 | -0.2653 | No | ||
| 17 | LDHC | 2030458 6100463 | 8132 | -0.000 | -0.2740 | No | ||
| 18 | PDHA2 | 2630438 | 8517 | -0.001 | -0.2946 | No | ||
| 19 | PGM3 | 2570465 | 8518 | -0.001 | -0.2946 | No | ||
| 20 | ALDOB | 4730324 | 8552 | -0.001 | -0.2963 | No | ||
| 21 | ALDH1A3 | 2100270 | 8773 | -0.002 | -0.3081 | No | ||
| 22 | ENO2 | 2320068 | 8815 | -0.002 | -0.3102 | No | ||
| 23 | BPGM | 5080520 | 8957 | -0.003 | -0.3177 | No | ||
| 24 | ADH4 | 6840301 | 9274 | -0.003 | -0.3346 | No | ||
| 25 | ADH7 | 60465 | 9722 | -0.005 | -0.3584 | No | ||
| 26 | ADHFE1 | 1990673 6840022 | 10121 | -0.006 | -0.3796 | No | ||
| 27 | PGK2 | 2650091 | 10207 | -0.006 | -0.3840 | No | ||
| 28 | ALDOC | 450121 610427 | 10575 | -0.007 | -0.4034 | No | ||
| 29 | PGM1 | 3840408 | 10697 | -0.008 | -0.4096 | No | ||
| 30 | GCK | 2370273 | 11298 | -0.010 | -0.4416 | No | ||
| 31 | GAPDH | 110022 430039 6220161 | 13338 | -0.027 | -0.5503 | No | ||
| 32 | GALM | 730368 | 13391 | -0.028 | -0.5520 | No | ||
| 33 | G6PC2 | 1660114 5220070 | 13608 | -0.032 | -0.5623 | No | ||
| 34 | FBP2 | 1580193 | 13986 | -0.039 | -0.5811 | No | ||
| 35 | G6PC | 430093 | 14155 | -0.043 | -0.5884 | No | ||
| 36 | HK3 | 3190288 6510142 | 14598 | -0.056 | -0.6100 | No | ||
| 37 | GAPDHS | 2690463 | 14608 | -0.056 | -0.6082 | No | ||
| 38 | ALDH3A1 | 580095 | 14866 | -0.065 | -0.6194 | No | ||
| 39 | HK1 | 4280402 | 15253 | -0.086 | -0.6367 | No | ||
| 40 | ACSS1 | 6580037 | 15596 | -0.113 | -0.6506 | No | ||
| 41 | LDHA | 2190594 | 15920 | -0.145 | -0.6621 | No | ||
| 42 | PDHB | 70215 610086 | 15955 | -0.151 | -0.6578 | No | ||
| 43 | PFKL | 6200167 | 17218 | -0.351 | -0.7116 | No | ||
| 44 | PGAM1 | 2570133 | 17350 | -0.383 | -0.7032 | No | ||
| 45 | ADH5 | 6290100 6380711 | 18248 | -0.901 | -0.7150 | Yes | ||
| 46 | ALDOA | 6290672 | 18304 | -0.964 | -0.6790 | Yes | ||
| 47 | PFKP | 70138 6760040 1170278 | 18334 | -1.022 | -0.6392 | Yes | ||
| 48 | ENO3 | 5270136 | 18458 | -1.372 | -0.5903 | Yes | ||
| 49 | ENO1 | 5340128 | 18494 | -1.566 | -0.5288 | Yes | ||
| 50 | FBP1 | 1470762 | 18514 | -1.688 | -0.4615 | Yes | ||
| 51 | PGAM2 | 3610605 | 18524 | -1.782 | -0.3899 | Yes | ||
| 52 | TPI1 | 1500215 2100154 | 18546 | -2.022 | -0.3092 | Yes | ||
| 53 | ALDH1B1 | 610195 | 18587 | -2.729 | -0.2010 | Yes | ||
| 54 | PGK1 | 1570494 630300 | 18610 | -5.004 | 0.0003 | Yes |