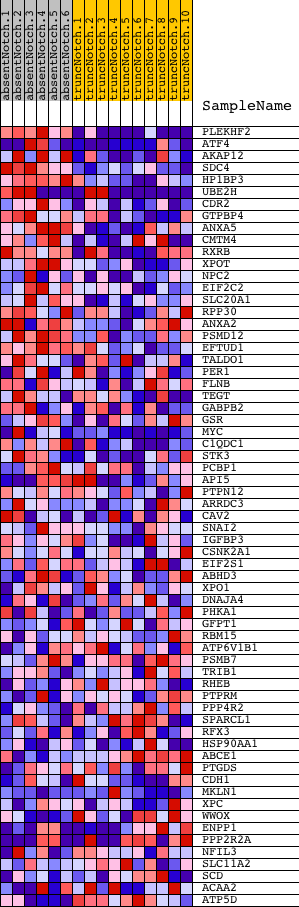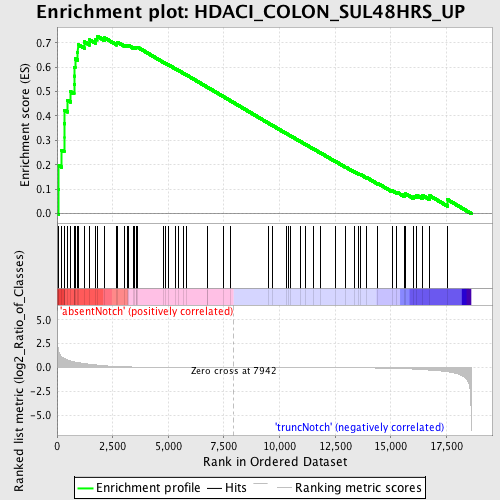
Profile of the Running ES Score & Positions of GeneSet Members on the Rank Ordered List
| Dataset | Set_03_absentNotch_versus_truncNotch.phenotype_absentNotch_versus_truncNotch.cls #absentNotch_versus_truncNotch.phenotype_absentNotch_versus_truncNotch.cls #absentNotch_versus_truncNotch_repos |
| Phenotype | phenotype_absentNotch_versus_truncNotch.cls#absentNotch_versus_truncNotch_repos |
| Upregulated in class | absentNotch |
| GeneSet | HDACI_COLON_SUL48HRS_UP |
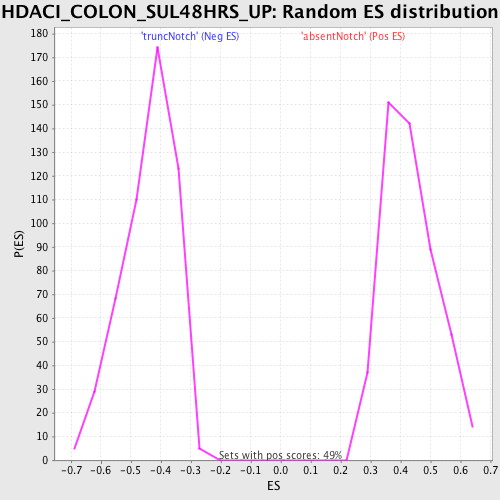
| Enrichment Score (ES) | 0.72707623 |
| Normalized Enrichment Score (NES) | 1.6862853 |
| Nominal p-value | 0.0 |
| FDR q-value | 0.04994185 |
| FWER p-Value | 0.288 |
| PROBE | DESCRIPTION (from dataset) | GENE SYMBOL | GENE_TITLE | RANK IN GENE LIST | RANK METRIC SCORE | RUNNING ES | CORE ENRICHMENT | |
|---|---|---|---|---|---|---|---|---|
| 1 | PLEKHF2 | 1850075 3840092 | 66 | 1.673 | 0.0996 | Yes | ||
| 2 | ATF4 | 730441 1740195 | 80 | 1.582 | 0.1963 | Yes | ||
| 3 | AKAP12 | 1450739 | 202 | 1.125 | 0.2592 | Yes | ||
| 4 | SDC4 | 6370411 | 316 | 0.938 | 0.3109 | Yes | ||
| 5 | HP1BP3 | 2650575 | 318 | 0.934 | 0.3683 | Yes | ||
| 6 | UBE2H | 1980142 2970079 | 343 | 0.912 | 0.4232 | Yes | ||
| 7 | CDR2 | 6200377 | 477 | 0.778 | 0.4640 | Yes | ||
| 8 | GTPBP4 | 6840332 | 610 | 0.685 | 0.4990 | Yes | ||
| 9 | ANXA5 | 1050373 | 761 | 0.604 | 0.5282 | Yes | ||
| 10 | CMTM4 | 360600 3520332 | 782 | 0.595 | 0.5637 | Yes | ||
| 11 | RXRB | 1780040 5340438 | 789 | 0.589 | 0.5997 | Yes | ||
| 12 | XPOT | 7050184 | 809 | 0.578 | 0.6343 | Yes | ||
| 13 | NPC2 | 2350102 | 916 | 0.539 | 0.6618 | Yes | ||
| 14 | EIF2C2 | 770451 | 938 | 0.525 | 0.6931 | Yes | ||
| 15 | SLC20A1 | 6420014 | 1221 | 0.418 | 0.7036 | Yes | ||
| 16 | RPP30 | 1980221 | 1466 | 0.344 | 0.7117 | Yes | ||
| 17 | ANXA2 | 3140402 | 1718 | 0.275 | 0.7151 | Yes | ||
| 18 | PSMD12 | 730044 | 1793 | 0.259 | 0.7271 | Yes | ||
| 19 | EFTUD1 | 5360736 | 2138 | 0.185 | 0.7199 | No | ||
| 20 | TALDO1 | 940400 | 2684 | 0.108 | 0.6972 | No | ||
| 21 | PER1 | 3290315 | 2704 | 0.106 | 0.7027 | No | ||
| 22 | FLNB | 2510575 | 3036 | 0.078 | 0.6897 | No | ||
| 23 | TEGT | 1770538 | 3158 | 0.070 | 0.6874 | No | ||
| 24 | GABPB2 | 6130450 7050735 | 3202 | 0.067 | 0.6892 | No | ||
| 25 | GSR | 3520079 | 3414 | 0.054 | 0.6811 | No | ||
| 26 | MYC | 380541 4670170 | 3486 | 0.050 | 0.6804 | No | ||
| 27 | C1QDC1 | 730025 1780735 2230026 | 3546 | 0.047 | 0.6801 | No | ||
| 28 | STK3 | 7100427 | 3565 | 0.046 | 0.6820 | No | ||
| 29 | PCBP1 | 1050088 | 3619 | 0.043 | 0.6818 | No | ||
| 30 | API5 | 540593 1740114 6980692 | 4783 | 0.014 | 0.6199 | No | ||
| 31 | PTPN12 | 2030309 6020725 6130746 6290609 | 4882 | 0.013 | 0.6154 | No | ||
| 32 | ARRDC3 | 4610390 | 5024 | 0.011 | 0.6085 | No | ||
| 33 | CAV2 | 5130286 5130563 | 5306 | 0.009 | 0.5940 | No | ||
| 34 | SNAI2 | 2100519 | 5457 | 0.008 | 0.5864 | No | ||
| 35 | IGFBP3 | 2370500 | 5663 | 0.007 | 0.5758 | No | ||
| 36 | CSNK2A1 | 1580577 | 5822 | 0.007 | 0.5677 | No | ||
| 37 | EIF2S1 | 5360292 | 6772 | 0.003 | 0.5168 | No | ||
| 38 | ABHD3 | 2370091 | 6777 | 0.003 | 0.5167 | No | ||
| 39 | XPO1 | 540707 | 7497 | 0.001 | 0.4781 | No | ||
| 40 | DNAJA4 | 780528 | 7783 | 0.000 | 0.4627 | No | ||
| 41 | PHKA1 | 2810162 4120040 6040722 | 9492 | -0.004 | 0.3709 | No | ||
| 42 | GFPT1 | 2120435 | 9672 | -0.004 | 0.3615 | No | ||
| 43 | RBM15 | 4760113 730286 | 10307 | -0.006 | 0.3277 | No | ||
| 44 | ATP6V1B1 | 6100181 | 10408 | -0.007 | 0.3228 | No | ||
| 45 | PSMB7 | 5570088 5890647 | 10492 | -0.007 | 0.3187 | No | ||
| 46 | TRIB1 | 2320435 | 10950 | -0.009 | 0.2946 | No | ||
| 47 | RHEB | 6760441 | 11157 | -0.009 | 0.2841 | No | ||
| 48 | PTPRM | 6370136 | 11502 | -0.011 | 0.2663 | No | ||
| 49 | PPP4R2 | 5890035 | 11825 | -0.013 | 0.2497 | No | ||
| 50 | SPARCL1 | 1990348 | 12529 | -0.018 | 0.2129 | No | ||
| 51 | RFX3 | 520121 4280519 5570519 6100184 | 12984 | -0.023 | 0.1898 | No | ||
| 52 | HSP90AA1 | 4560041 5220133 2120722 | 13348 | -0.027 | 0.1719 | No | ||
| 53 | ABCE1 | 4280050 | 13559 | -0.031 | 0.1625 | No | ||
| 54 | PTGDS | 3610519 | 13636 | -0.032 | 0.1604 | No | ||
| 55 | CDH1 | 1940736 | 13914 | -0.037 | 0.1478 | No | ||
| 56 | MKLN1 | 70504 1850129 | 14419 | -0.050 | 0.1237 | No | ||
| 57 | XPC | 6370193 | 15067 | -0.075 | 0.0935 | No | ||
| 58 | WWOX | 510008 870524 1090114 | 15271 | -0.087 | 0.0879 | No | ||
| 59 | ENPP1 | 780609 | 15609 | -0.114 | 0.0767 | No | ||
| 60 | PPP2R2A | 2900014 5700575 | 15643 | -0.116 | 0.0821 | No | ||
| 61 | NFIL3 | 4070377 | 16035 | -0.163 | 0.0711 | No | ||
| 62 | SLC11A2 | 3140603 | 16164 | -0.180 | 0.0753 | No | ||
| 63 | SCD | 2680441 | 16413 | -0.216 | 0.0753 | No | ||
| 64 | ACAA2 | 1570347 2360324 6130139 | 16752 | -0.264 | 0.0733 | No | ||
| 65 | ATP5D | 6550167 | 17553 | -0.440 | 0.0573 | No |