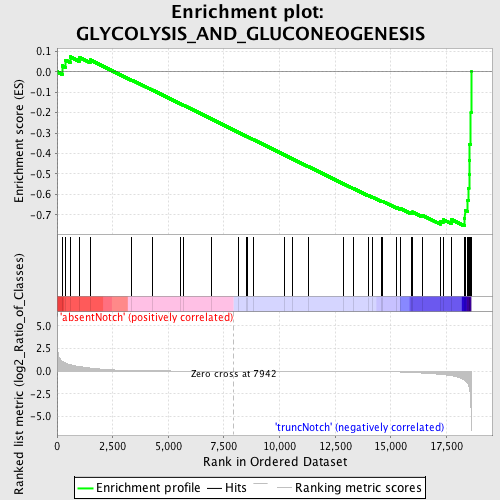
Profile of the Running ES Score & Positions of GeneSet Members on the Rank Ordered List
| Dataset | Set_03_absentNotch_versus_truncNotch.phenotype_absentNotch_versus_truncNotch.cls #absentNotch_versus_truncNotch.phenotype_absentNotch_versus_truncNotch.cls #absentNotch_versus_truncNotch_repos |
| Phenotype | phenotype_absentNotch_versus_truncNotch.cls#absentNotch_versus_truncNotch_repos |
| Upregulated in class | truncNotch |
| GeneSet | GLYCOLYSIS_AND_GLUCONEOGENESIS |
| Enrichment Score (ES) | -0.75438446 |
| Normalized Enrichment Score (NES) | -1.5765713 |
| Nominal p-value | 0.012072435 |
| FDR q-value | 0.45404962 |
| FWER p-Value | 0.978 |
| PROBE | DESCRIPTION (from dataset) | GENE SYMBOL | GENE_TITLE | RANK IN GENE LIST | RANK METRIC SCORE | RUNNING ES | CORE ENRICHMENT | |
|---|---|---|---|---|---|---|---|---|
| 1 | PKM2 | 6520403 70500 | 229 | 1.062 | 0.0298 | No | ||
| 2 | PDHA1 | 5550397 | 371 | 0.879 | 0.0570 | No | ||
| 3 | HK2 | 2640722 | 588 | 0.700 | 0.0731 | No | ||
| 4 | PFKM | 1990156 5720168 | 991 | 0.504 | 0.0715 | No | ||
| 5 | DLAT | 430452 | 1488 | 0.338 | 0.0582 | No | ||
| 6 | DLD | 4150403 6590341 | 3362 | 0.057 | -0.0404 | No | ||
| 7 | MDH1 | 6660358 6760731 | 4297 | 0.021 | -0.0898 | No | ||
| 8 | LDHAL6B | 5130280 | 5526 | 0.008 | -0.1556 | No | ||
| 9 | PKLR | 1170400 2470114 | 5677 | 0.007 | -0.1634 | No | ||
| 10 | PDHX | 870315 | 6919 | 0.003 | -0.2301 | No | ||
| 11 | LDHC | 2030458 6100463 | 8132 | -0.000 | -0.2953 | No | ||
| 12 | PDHA2 | 2630438 | 8517 | -0.001 | -0.3159 | No | ||
| 13 | ALDOB | 4730324 | 8552 | -0.001 | -0.3177 | No | ||
| 14 | ENO2 | 2320068 | 8815 | -0.002 | -0.3317 | No | ||
| 15 | PGK2 | 2650091 | 10207 | -0.006 | -0.4063 | No | ||
| 16 | ALDOC | 450121 610427 | 10575 | -0.007 | -0.4258 | No | ||
| 17 | GCK | 2370273 | 11298 | -0.010 | -0.4642 | No | ||
| 18 | PCK1 | 7000358 | 12894 | -0.022 | -0.5492 | No | ||
| 19 | GAPDH | 110022 430039 6220161 | 13338 | -0.027 | -0.5720 | No | ||
| 20 | FBP2 | 1580193 | 13986 | -0.039 | -0.6053 | No | ||
| 21 | G6PC | 430093 | 14155 | -0.043 | -0.6127 | No | ||
| 22 | HK3 | 3190288 6510142 | 14598 | -0.056 | -0.6343 | No | ||
| 23 | GAPDHS | 2690463 | 14608 | -0.056 | -0.6325 | No | ||
| 24 | HK1 | 4280402 | 15253 | -0.086 | -0.6638 | No | ||
| 25 | MDH2 | 1850601 | 15423 | -0.097 | -0.6690 | No | ||
| 26 | LDHA | 2190594 | 15920 | -0.145 | -0.6900 | No | ||
| 27 | PDHB | 70215 610086 | 15955 | -0.151 | -0.6858 | No | ||
| 28 | TNFAIP1 | 6940593 | 16414 | -0.216 | -0.7019 | No | ||
| 29 | PFKL | 6200167 | 17218 | -0.351 | -0.7312 | Yes | ||
| 30 | PGAM1 | 2570133 | 17350 | -0.383 | -0.7231 | Yes | ||
| 31 | GOT1 | 2940465 | 17733 | -0.503 | -0.7237 | Yes | ||
| 32 | ALDOA | 6290672 | 18304 | -0.964 | -0.7162 | Yes | ||
| 33 | PFKP | 70138 6760040 1170278 | 18334 | -1.022 | -0.6772 | Yes | ||
| 34 | ENO3 | 5270136 | 18458 | -1.372 | -0.6294 | Yes | ||
| 35 | ENO1 | 5340128 | 18494 | -1.566 | -0.5692 | Yes | ||
| 36 | FBP1 | 1470762 | 18514 | -1.688 | -0.5033 | Yes | ||
| 37 | PGAM2 | 3610605 | 18524 | -1.782 | -0.4332 | Yes | ||
| 38 | TPI1 | 1500215 2100154 | 18546 | -2.022 | -0.3542 | Yes | ||
| 39 | GOT2 | 4570164 5220450 | 18602 | -4.022 | -0.1977 | Yes | ||
| 40 | PGK1 | 1570494 630300 | 18610 | -5.004 | 0.0003 | Yes |

