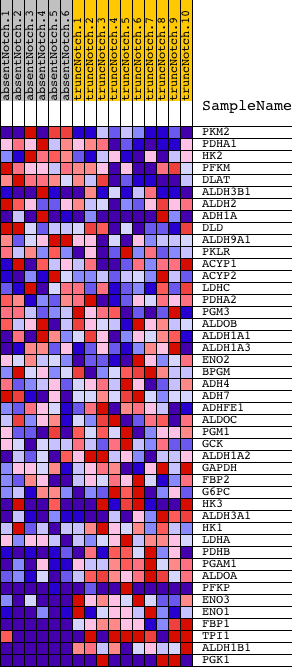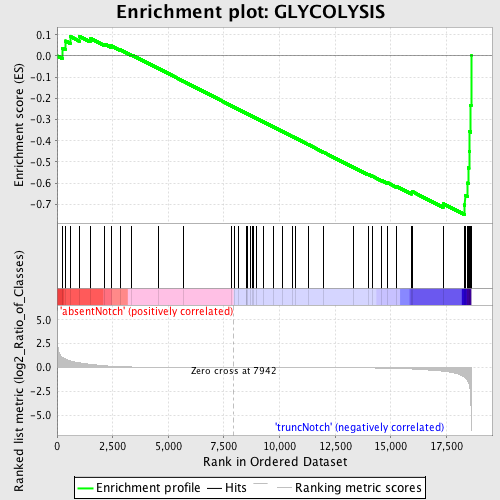
Profile of the Running ES Score & Positions of GeneSet Members on the Rank Ordered List
| Dataset | Set_03_absentNotch_versus_truncNotch.phenotype_absentNotch_versus_truncNotch.cls #absentNotch_versus_truncNotch.phenotype_absentNotch_versus_truncNotch.cls #absentNotch_versus_truncNotch_repos |
| Phenotype | phenotype_absentNotch_versus_truncNotch.cls#absentNotch_versus_truncNotch_repos |
| Upregulated in class | truncNotch |
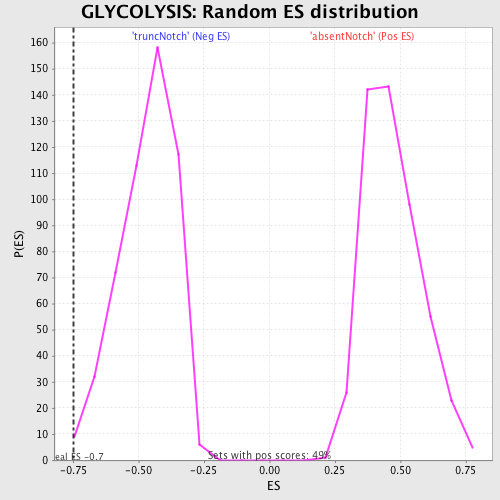
| GeneSet | GLYCOLYSIS |
| Enrichment Score (ES) | -0.74803406 |
| Normalized Enrichment Score (NES) | -1.5970396 |
| Nominal p-value | 0.007889546 |
| FDR q-value | 0.5486418 |
| FWER p-Value | 0.931 |
| PROBE | DESCRIPTION (from dataset) | GENE SYMBOL | GENE_TITLE | RANK IN GENE LIST | RANK METRIC SCORE | RUNNING ES | CORE ENRICHMENT | |
|---|---|---|---|---|---|---|---|---|
| 1 | PKM2 | 6520403 70500 | 229 | 1.062 | 0.0373 | No | ||
| 2 | PDHA1 | 5550397 | 371 | 0.879 | 0.0707 | No | ||
| 3 | HK2 | 2640722 | 588 | 0.700 | 0.0918 | No | ||
| 4 | PFKM | 1990156 5720168 | 991 | 0.504 | 0.0937 | No | ||
| 5 | DLAT | 430452 | 1488 | 0.338 | 0.0828 | No | ||
| 6 | ALDH3B1 | 4210010 6940403 | 2143 | 0.184 | 0.0562 | No | ||
| 7 | ALDH2 | 4230019 | 2422 | 0.138 | 0.0477 | No | ||
| 8 | ADH1A | 3170427 | 2829 | 0.095 | 0.0303 | No | ||
| 9 | DLD | 4150403 6590341 | 3362 | 0.057 | 0.0043 | No | ||
| 10 | ALDH9A1 | 4810047 | 4563 | 0.017 | -0.0596 | No | ||
| 11 | PKLR | 1170400 2470114 | 5677 | 0.007 | -0.1192 | No | ||
| 12 | ACYP1 | 6380403 | 7855 | 0.000 | -0.2364 | No | ||
| 13 | ACYP2 | 2510605 | 7970 | -0.000 | -0.2425 | No | ||
| 14 | LDHC | 2030458 6100463 | 8132 | -0.000 | -0.2512 | No | ||
| 15 | PDHA2 | 2630438 | 8517 | -0.001 | -0.2718 | No | ||
| 16 | PGM3 | 2570465 | 8518 | -0.001 | -0.2717 | No | ||
| 17 | ALDOB | 4730324 | 8552 | -0.001 | -0.2734 | No | ||
| 18 | ALDH1A1 | 6520706 | 8677 | -0.002 | -0.2800 | No | ||
| 19 | ALDH1A3 | 2100270 | 8773 | -0.002 | -0.2850 | No | ||
| 20 | ENO2 | 2320068 | 8815 | -0.002 | -0.2871 | No | ||
| 21 | BPGM | 5080520 | 8957 | -0.003 | -0.2946 | No | ||
| 22 | ADH4 | 6840301 | 9274 | -0.003 | -0.3114 | No | ||
| 23 | ADH7 | 60465 | 9722 | -0.005 | -0.3353 | No | ||
| 24 | ADHFE1 | 1990673 6840022 | 10121 | -0.006 | -0.3565 | No | ||
| 25 | ALDOC | 450121 610427 | 10575 | -0.007 | -0.3805 | No | ||
| 26 | PGM1 | 3840408 | 10697 | -0.008 | -0.3866 | No | ||
| 27 | GCK | 2370273 | 11298 | -0.010 | -0.4185 | No | ||
| 28 | ALDH1A2 | 2320301 | 11992 | -0.014 | -0.4551 | No | ||
| 29 | GAPDH | 110022 430039 6220161 | 13338 | -0.027 | -0.5263 | No | ||
| 30 | FBP2 | 1580193 | 13986 | -0.039 | -0.5593 | No | ||
| 31 | G6PC | 430093 | 14155 | -0.043 | -0.5664 | No | ||
| 32 | HK3 | 3190288 6510142 | 14598 | -0.056 | -0.5876 | No | ||
| 33 | ALDH3A1 | 580095 | 14866 | -0.065 | -0.5989 | No | ||
| 34 | HK1 | 4280402 | 15253 | -0.086 | -0.6157 | No | ||
| 35 | LDHA | 2190594 | 15920 | -0.145 | -0.6448 | No | ||
| 36 | PDHB | 70215 610086 | 15955 | -0.151 | -0.6395 | No | ||
| 37 | PGAM1 | 2570133 | 17350 | -0.383 | -0.6967 | No | ||
| 38 | ALDOA | 6290672 | 18304 | -0.964 | -0.7030 | Yes | ||
| 39 | PFKP | 70138 6760040 1170278 | 18334 | -1.022 | -0.6568 | Yes | ||
| 40 | ENO3 | 5270136 | 18458 | -1.372 | -0.5994 | Yes | ||
| 41 | ENO1 | 5340128 | 18494 | -1.566 | -0.5281 | Yes | ||
| 42 | FBP1 | 1470762 | 18514 | -1.688 | -0.4503 | Yes | ||
| 43 | TPI1 | 1500215 2100154 | 18546 | -2.022 | -0.3575 | Yes | ||
| 44 | ALDH1B1 | 610195 | 18587 | -2.729 | -0.2322 | Yes | ||
| 45 | PGK1 | 1570494 630300 | 18610 | -5.004 | 0.0003 | Yes |