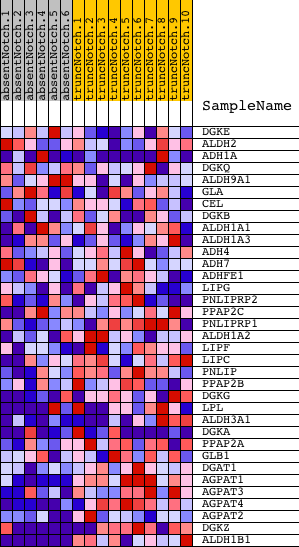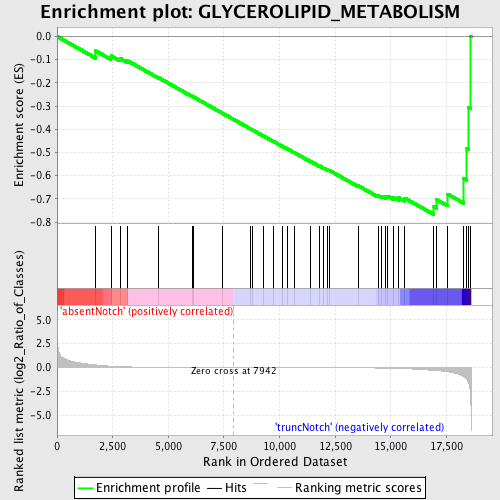
Profile of the Running ES Score & Positions of GeneSet Members on the Rank Ordered List
| Dataset | Set_03_absentNotch_versus_truncNotch.phenotype_absentNotch_versus_truncNotch.cls #absentNotch_versus_truncNotch.phenotype_absentNotch_versus_truncNotch.cls #absentNotch_versus_truncNotch_repos |
| Phenotype | phenotype_absentNotch_versus_truncNotch.cls#absentNotch_versus_truncNotch_repos |
| Upregulated in class | truncNotch |
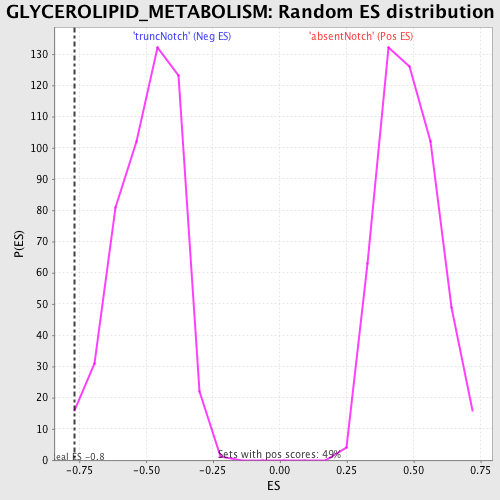
| GeneSet | GLYCEROLIPID_METABOLISM |
| Enrichment Score (ES) | -0.76728135 |
| Normalized Enrichment Score (NES) | -1.5509977 |
| Nominal p-value | 0.005905512 |
| FDR q-value | 0.49226174 |
| FWER p-Value | 0.995 |
| PROBE | DESCRIPTION (from dataset) | GENE SYMBOL | GENE_TITLE | RANK IN GENE LIST | RANK METRIC SCORE | RUNNING ES | CORE ENRICHMENT | |
|---|---|---|---|---|---|---|---|---|
| 1 | DGKE | 5910736 | 1733 | 0.272 | -0.0622 | No | ||
| 2 | ALDH2 | 4230019 | 2422 | 0.138 | -0.0835 | No | ||
| 3 | ADH1A | 3170427 | 2829 | 0.095 | -0.0944 | No | ||
| 4 | DGKQ | 2480609 | 3172 | 0.068 | -0.1050 | No | ||
| 5 | ALDH9A1 | 4810047 | 4563 | 0.017 | -0.1779 | No | ||
| 6 | GLA | 4610364 | 6084 | 0.006 | -0.2591 | No | ||
| 7 | CEL | 2640278 | 6147 | 0.005 | -0.2618 | No | ||
| 8 | DGKB | 1850300 | 7445 | 0.001 | -0.3315 | No | ||
| 9 | ALDH1A1 | 6520706 | 8677 | -0.002 | -0.3975 | No | ||
| 10 | ALDH1A3 | 2100270 | 8773 | -0.002 | -0.4024 | No | ||
| 11 | ADH4 | 6840301 | 9274 | -0.003 | -0.4289 | No | ||
| 12 | ADH7 | 60465 | 9722 | -0.005 | -0.4524 | No | ||
| 13 | ADHFE1 | 1990673 6840022 | 10121 | -0.006 | -0.4732 | No | ||
| 14 | LIPG | 1770040 | 10372 | -0.007 | -0.4859 | No | ||
| 15 | PNLIPRP2 | 130131 | 10674 | -0.008 | -0.5012 | No | ||
| 16 | PPAP2C | 2970348 | 11388 | -0.011 | -0.5383 | No | ||
| 17 | PNLIPRP1 | 360433 | 11775 | -0.013 | -0.5577 | No | ||
| 18 | ALDH1A2 | 2320301 | 11992 | -0.014 | -0.5677 | No | ||
| 19 | LIPF | 5050368 | 12154 | -0.015 | -0.5747 | No | ||
| 20 | LIPC | 2690497 | 12235 | -0.016 | -0.5772 | No | ||
| 21 | PNLIP | 6450341 | 13543 | -0.031 | -0.6440 | No | ||
| 22 | PPAP2B | 3190397 4730280 | 14423 | -0.050 | -0.6856 | No | ||
| 23 | DGKG | 1770025 | 14594 | -0.055 | -0.6884 | No | ||
| 24 | LPL | 1450735 2970706 | 14755 | -0.061 | -0.6901 | No | ||
| 25 | ALDH3A1 | 580095 | 14866 | -0.065 | -0.6886 | No | ||
| 26 | DGKA | 5720152 5890328 | 15108 | -0.078 | -0.6927 | No | ||
| 27 | PPAP2A | 1170397 3440288 3930270 | 15357 | -0.092 | -0.6955 | No | ||
| 28 | GLB1 | 6840673 | 15616 | -0.114 | -0.6964 | No | ||
| 29 | DGAT1 | 1850538 | 16935 | -0.297 | -0.7334 | Yes | ||
| 30 | AGPAT1 | 610056 | 17054 | -0.319 | -0.7033 | Yes | ||
| 31 | AGPAT3 | 60152 | 17563 | -0.444 | -0.6800 | Yes | ||
| 32 | AGPAT4 | 6040079 | 18276 | -0.930 | -0.6121 | Yes | ||
| 33 | AGPAT2 | 6110592 | 18417 | -1.212 | -0.4813 | Yes | ||
| 34 | DGKZ | 3460041 6400129 | 18500 | -1.580 | -0.3053 | Yes | ||
| 35 | ALDH1B1 | 610195 | 18587 | -2.729 | 0.0016 | Yes |