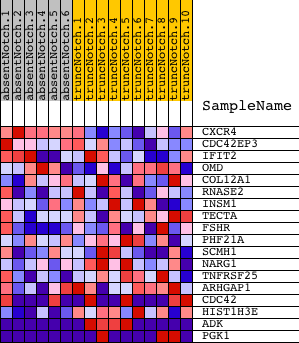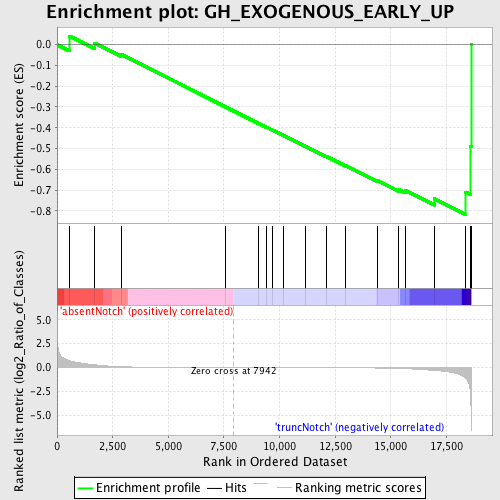
Profile of the Running ES Score & Positions of GeneSet Members on the Rank Ordered List
| Dataset | Set_03_absentNotch_versus_truncNotch.phenotype_absentNotch_versus_truncNotch.cls #absentNotch_versus_truncNotch.phenotype_absentNotch_versus_truncNotch.cls #absentNotch_versus_truncNotch_repos |
| Phenotype | phenotype_absentNotch_versus_truncNotch.cls#absentNotch_versus_truncNotch_repos |
| Upregulated in class | truncNotch |
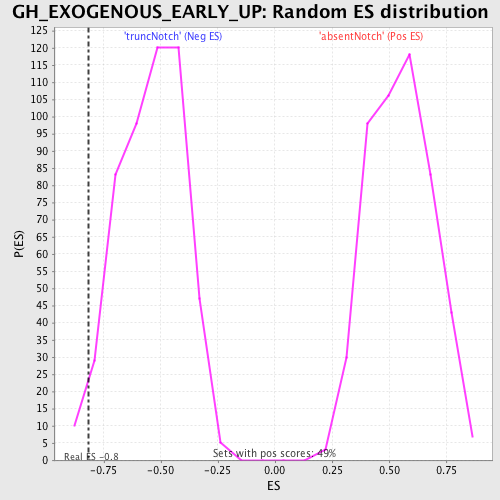
| GeneSet | GH_EXOGENOUS_EARLY_UP |
| Enrichment Score (ES) | -0.81760544 |
| Normalized Enrichment Score (NES) | -1.504487 |
| Nominal p-value | 0.02734375 |
| FDR q-value | 0.52178067 |
| FWER p-Value | 1.0 |
| PROBE | DESCRIPTION (from dataset) | GENE SYMBOL | GENE_TITLE | RANK IN GENE LIST | RANK METRIC SCORE | RUNNING ES | CORE ENRICHMENT | |
|---|---|---|---|---|---|---|---|---|
| 1 | CXCR4 | 4590519 | 553 | 0.720 | 0.0410 | No | ||
| 2 | CDC42EP3 | 2480138 | 1696 | 0.281 | 0.0073 | No | ||
| 3 | IFIT2 | 4810735 | 2875 | 0.091 | -0.0471 | No | ||
| 4 | OMD | 6110044 | 7561 | 0.001 | -0.2989 | No | ||
| 5 | COL12A1 | 1990025 3780086 | 9070 | -0.003 | -0.3797 | No | ||
| 6 | RNASE2 | 3290563 | 9415 | -0.004 | -0.3979 | No | ||
| 7 | INSM1 | 3450671 | 9687 | -0.005 | -0.4120 | No | ||
| 8 | TECTA | 2570372 | 10195 | -0.006 | -0.4386 | No | ||
| 9 | FSHR | 610041 7040121 | 11143 | -0.009 | -0.4886 | No | ||
| 10 | PHF21A | 610014 | 12113 | -0.015 | -0.5393 | No | ||
| 11 | SCMH1 | 3190019 6770450 | 12980 | -0.023 | -0.5836 | No | ||
| 12 | NARG1 | 5910563 6350095 | 14397 | -0.050 | -0.6549 | No | ||
| 13 | TNFRSF25 | 3710110 3850707 | 15362 | -0.093 | -0.6976 | No | ||
| 14 | ARHGAP1 | 2810010 5270064 | 15668 | -0.119 | -0.7024 | No | ||
| 15 | CDC42 | 1240168 3440278 4480519 5290162 | 16969 | -0.304 | -0.7424 | Yes | ||
| 16 | HIST1H3E | 840398 | 18368 | -1.101 | -0.7095 | Yes | ||
| 17 | ADK | 380338 520180 5270524 | 18565 | -2.353 | -0.4889 | Yes | ||
| 18 | PGK1 | 1570494 630300 | 18610 | -5.004 | 0.0003 | Yes |