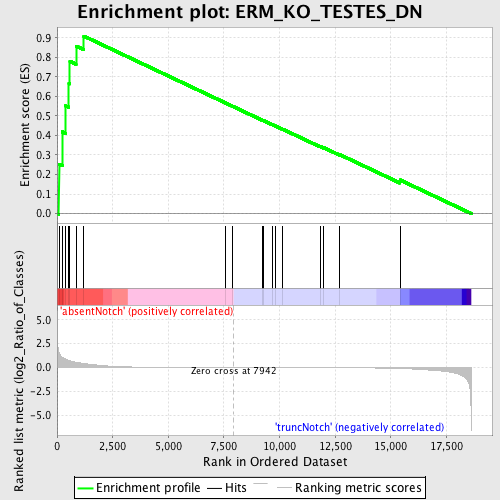
Profile of the Running ES Score & Positions of GeneSet Members on the Rank Ordered List
| Dataset | Set_03_absentNotch_versus_truncNotch.phenotype_absentNotch_versus_truncNotch.cls #absentNotch_versus_truncNotch.phenotype_absentNotch_versus_truncNotch.cls #absentNotch_versus_truncNotch_repos |
| Phenotype | phenotype_absentNotch_versus_truncNotch.cls#absentNotch_versus_truncNotch_repos |
| Upregulated in class | absentNotch |
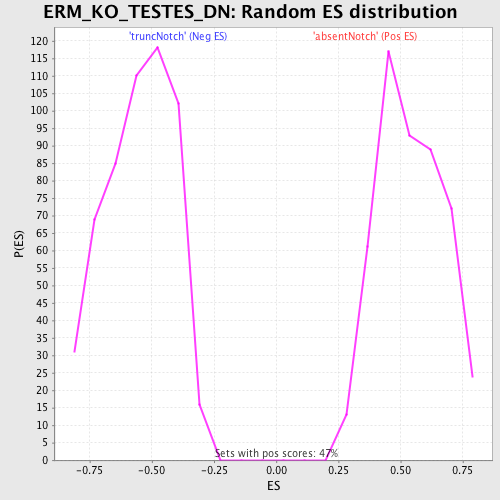
| GeneSet | ERM_KO_TESTES_DN |
| Enrichment Score (ES) | 0.90830857 |
| Normalized Enrichment Score (NES) | 1.6827475 |
| Nominal p-value | 0.0 |
| FDR q-value | 0.048109878 |
| FWER p-Value | 0.309 |
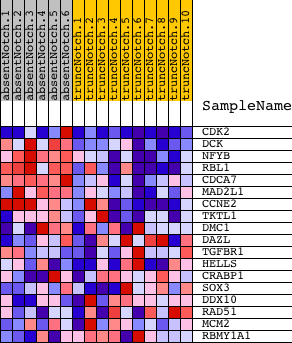
| PROBE | DESCRIPTION (from dataset) | GENE SYMBOL | GENE_TITLE | RANK IN GENE LIST | RANK METRIC SCORE | RUNNING ES | CORE ENRICHMENT | |
|---|---|---|---|---|---|---|---|---|
| 1 | CDK2 | 130484 2260301 4010088 5050110 | 84 | 1.554 | 0.2517 | Yes | ||
| 2 | DCK | 6900411 | 231 | 1.060 | 0.4187 | Yes | ||
| 3 | NFYB | 1850053 | 390 | 0.854 | 0.5511 | Yes | ||
| 4 | RBL1 | 3130372 | 532 | 0.741 | 0.6656 | Yes | ||
| 5 | CDCA7 | 3060097 | 577 | 0.705 | 0.7795 | Yes | ||
| 6 | MAD2L1 | 4480725 | 852 | 0.562 | 0.8574 | Yes | ||
| 7 | CCNE2 | 3120537 | 1203 | 0.423 | 0.9083 | Yes | ||
| 8 | TKTL1 | 2810672 6760102 | 7568 | 0.001 | 0.5663 | No | ||
| 9 | DMC1 | 450341 | 7875 | 0.000 | 0.5499 | No | ||
| 10 | DAZL | 4050082 | 9226 | -0.003 | 0.4778 | No | ||
| 11 | TGFBR1 | 1400148 4280020 6550711 | 9263 | -0.003 | 0.4764 | No | ||
| 12 | HELLS | 4560086 4810025 | 9667 | -0.004 | 0.4555 | No | ||
| 13 | CRABP1 | 450278 | 9827 | -0.005 | 0.4478 | No | ||
| 14 | SOX3 | 4570537 | 10142 | -0.006 | 0.4319 | No | ||
| 15 | DDX10 | 520746 | 11821 | -0.013 | 0.3438 | No | ||
| 16 | RAD51 | 6110450 6980280 | 11989 | -0.014 | 0.3371 | No | ||
| 17 | MCM2 | 5050139 | 12705 | -0.020 | 0.3019 | No | ||
| 18 | RBMY1A1 | 6200053 | 15412 | -0.096 | 0.1723 | No |