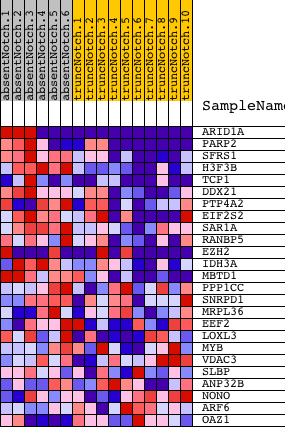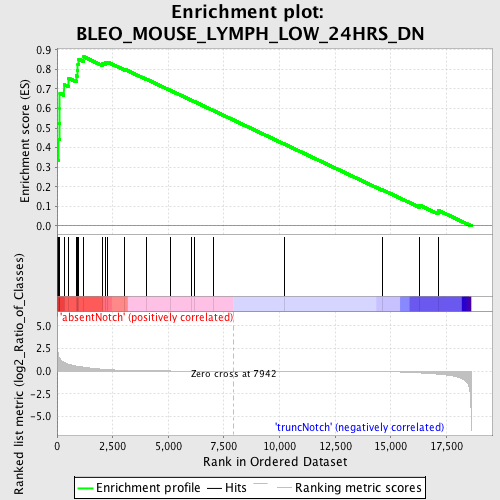
Profile of the Running ES Score & Positions of GeneSet Members on the Rank Ordered List
| Dataset | Set_03_absentNotch_versus_truncNotch.phenotype_absentNotch_versus_truncNotch.cls #absentNotch_versus_truncNotch.phenotype_absentNotch_versus_truncNotch.cls #absentNotch_versus_truncNotch_repos |
| Phenotype | phenotype_absentNotch_versus_truncNotch.cls#absentNotch_versus_truncNotch_repos |
| Upregulated in class | absentNotch |
| GeneSet | BLEO_MOUSE_LYMPH_LOW_24HRS_DN |
| Enrichment Score (ES) | 0.8641582 |
| Normalized Enrichment Score (NES) | 1.7259479 |
| Nominal p-value | 0.0 |
| FDR q-value | 0.025342066 |
| FWER p-Value | 0.102 |
| PROBE | DESCRIPTION (from dataset) | GENE SYMBOL | GENE_TITLE | RANK IN GENE LIST | RANK METRIC SCORE | RUNNING ES | CORE ENRICHMENT | |
|---|---|---|---|---|---|---|---|---|
| 1 | ARID1A | 2630022 1690551 4810110 | 0 | 5.910 | 0.3373 | Yes | ||
| 2 | PARP2 | 4920039 6510097 1500750 | 51 | 1.892 | 0.4426 | Yes | ||
| 3 | SFRS1 | 2360440 | 105 | 1.447 | 0.5224 | Yes | ||
| 4 | H3F3B | 1410300 | 124 | 1.379 | 0.6001 | Yes | ||
| 5 | TCP1 | 2450100 5130524 | 127 | 1.371 | 0.6782 | Yes | ||
| 6 | DDX21 | 6100446 | 309 | 0.946 | 0.7225 | Yes | ||
| 7 | PTP4A2 | 870154 6040070 6130242 6760224 | 507 | 0.757 | 0.7551 | Yes | ||
| 8 | EIF2S2 | 770095 2810487 | 867 | 0.556 | 0.7675 | Yes | ||
| 9 | SAR1A | 3450253 | 898 | 0.544 | 0.7969 | Yes | ||
| 10 | RANBP5 | 3780019 | 934 | 0.527 | 0.8251 | Yes | ||
| 11 | EZH2 | 6130605 6380524 | 974 | 0.510 | 0.8521 | Yes | ||
| 12 | IDH3A | 460332 | 1201 | 0.424 | 0.8642 | Yes | ||
| 13 | MBTD1 | 5910400 | 2050 | 0.200 | 0.8299 | No | ||
| 14 | PPP1CC | 6380300 2510647 | 2165 | 0.179 | 0.8340 | No | ||
| 15 | SNRPD1 | 4480162 | 2282 | 0.159 | 0.8369 | No | ||
| 16 | MRPL36 | 1450048 | 3042 | 0.077 | 0.8005 | No | ||
| 17 | EEF2 | 1050369 4670035 5890598 | 3998 | 0.029 | 0.7507 | No | ||
| 18 | LOXL3 | 4010168 | 5098 | 0.011 | 0.6923 | No | ||
| 19 | MYB | 1660494 5860451 6130706 | 6022 | 0.006 | 0.6429 | No | ||
| 20 | VDAC3 | 5390088 | 6163 | 0.005 | 0.6357 | No | ||
| 21 | SLBP | 6220601 | 7017 | 0.002 | 0.5900 | No | ||
| 22 | ANP32B | 940095 2450494 4200368 | 10200 | -0.006 | 0.4192 | No | ||
| 23 | NONO | 7050014 | 14613 | -0.056 | 0.1851 | No | ||
| 24 | ARF6 | 3520026 | 16291 | -0.197 | 0.1061 | No | ||
| 25 | OAZ1 | 110181 | 17125 | -0.331 | 0.0802 | No |