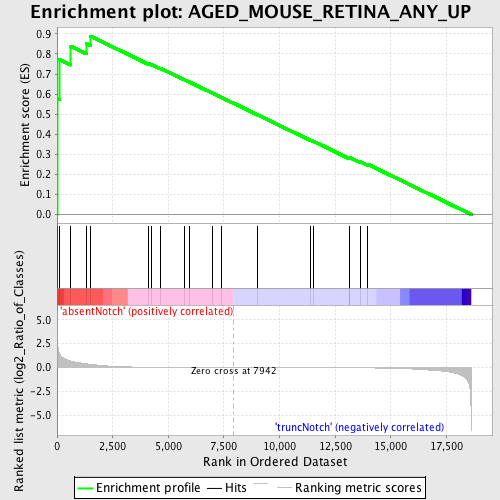
Profile of the Running ES Score & Positions of GeneSet Members on the Rank Ordered List
| Dataset | Set_03_absentNotch_versus_truncNotch.phenotype_absentNotch_versus_truncNotch.cls #absentNotch_versus_truncNotch.phenotype_absentNotch_versus_truncNotch.cls #absentNotch_versus_truncNotch_repos |
| Phenotype | phenotype_absentNotch_versus_truncNotch.cls#absentNotch_versus_truncNotch_repos |
| Upregulated in class | absentNotch |
| GeneSet | AGED_MOUSE_RETINA_ANY_UP |
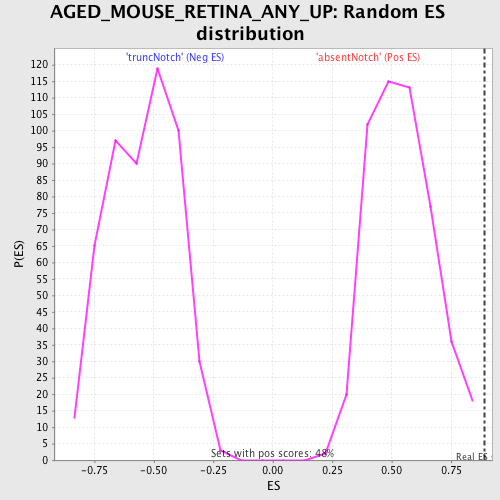
| Enrichment Score (ES) | 0.88907504 |
| Normalized Enrichment Score (NES) | 1.6436589 |
| Nominal p-value | 0.0 |
| FDR q-value | 0.072169736 |
| FWER p-Value | 0.602 |
| PROBE | DESCRIPTION (from dataset) | GENE SYMBOL | GENE_TITLE | RANK IN GENE LIST | RANK METRIC SCORE | RUNNING ES | CORE ENRICHMENT | |
|---|---|---|---|---|---|---|---|---|
| 1 | B2M | 5080332 5130059 | 1 | 4.225 | 0.5792 | Yes | ||
| 2 | RBM3 | 2360739 5700167 | 103 | 1.452 | 0.7728 | Yes | ||
| 3 | DHRS7 | 2970372 5290193 | 620 | 0.678 | 0.8381 | Yes | ||
| 4 | SLC38A2 | 1470242 3800026 | 1329 | 0.378 | 0.8518 | Yes | ||
| 5 | TSG101 | 770148 | 1495 | 0.337 | 0.8891 | Yes | ||
| 6 | MLF1 | 4570722 | 4128 | 0.025 | 0.7510 | No | ||
| 7 | RGR | 730156 6400368 | 4241 | 0.022 | 0.7480 | No | ||
| 8 | ATF3 | 1940546 | 4637 | 0.016 | 0.7289 | No | ||
| 9 | COL18A1 | 610301 4570338 | 5714 | 0.007 | 0.6720 | No | ||
| 10 | TSPAN5 | 6770019 | 5964 | 0.006 | 0.6595 | No | ||
| 11 | ENPP2 | 5860546 | 7006 | 0.002 | 0.6039 | No | ||
| 12 | SREBF1 | 4780333 | 7392 | 0.001 | 0.5833 | No | ||
| 13 | ABCA1 | 6290156 | 9021 | -0.003 | 0.4962 | No | ||
| 14 | SMAD1 | 630537 1850333 | 11379 | -0.011 | 0.3709 | No | ||
| 15 | COL19A1 | 6220441 | 11503 | -0.011 | 0.3658 | No | ||
| 16 | ELL2 | 6420091 | 13143 | -0.025 | 0.2811 | No | ||
| 17 | HDC | 4150463 | 13161 | -0.025 | 0.2835 | No | ||
| 18 | PTGDS | 3610519 | 13636 | -0.032 | 0.2625 | No | ||
| 19 | CEBPD | 3360176 | 13966 | -0.038 | 0.2500 | No |