Profile of the Running ES Score & Positions of GeneSet Members on the Rank Ordered List
| Dataset | Set_03_absentNotch_versus_truncNotch.phenotype_absentNotch_versus_truncNotch.cls #absentNotch_versus_truncNotch.phenotype_absentNotch_versus_truncNotch.cls #absentNotch_versus_truncNotch_repos |
| Phenotype | phenotype_absentNotch_versus_truncNotch.cls#absentNotch_versus_truncNotch_repos |
| Upregulated in class | absentNotch |
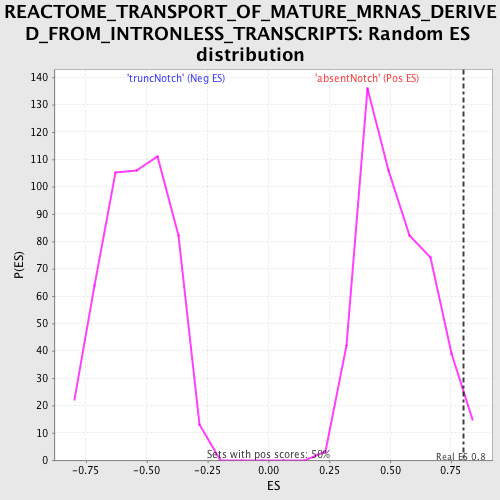
| GeneSet | REACTOME_TRANSPORT_OF_MATURE_MRNAS_DERIVED_FROM_INTRONLESS_TRANSCRIPTS |
| Enrichment Score (ES) | 0.8030409 |
| Normalized Enrichment Score (NES) | 1.5328246 |
| Nominal p-value | 0.022132797 |
| FDR q-value | 0.39325744 |
| FWER p-Value | 0.972 |
| PROBE | DESCRIPTION (from dataset) | GENE SYMBOL | GENE_TITLE | RANK IN GENE LIST | RANK METRIC SCORE | RUNNING ES | CORE ENRICHMENT | |
|---|---|---|---|---|---|---|---|---|
| 1 | NUP107 | 6380021 | 407 | 0.840 | 0.1882 | Yes | ||
| 2 | NUP160 | 1990551 | 799 | 0.584 | 0.3132 | Yes | ||
| 3 | NUP43 | 3360482 | 806 | 0.580 | 0.4578 | Yes | ||
| 4 | NUP93 | 2190273 | 1081 | 0.467 | 0.5599 | Yes | ||
| 5 | NUP155 | 5720576 6220114 | 1091 | 0.462 | 0.6750 | Yes | ||
| 6 | THOC4 | 3800731 6400114 | 1215 | 0.420 | 0.7735 | Yes | ||
| 7 | NCBP2 | 5340500 | 2206 | 0.171 | 0.7630 | Yes | ||
| 8 | CPSF1 | 6290064 | 2230 | 0.165 | 0.8030 | Yes | ||
| 9 | RAE1 | 7050121 | 3417 | 0.053 | 0.7526 | No | ||
| 10 | NUP37 | 2370097 6370435 6380008 | 3587 | 0.045 | 0.7547 | No | ||
| 11 | EIF4E | 1580403 70133 6380215 | 3698 | 0.039 | 0.7587 | No | ||
| 12 | RANBP2 | 4280338 | 3778 | 0.036 | 0.7635 | No | ||
| 13 | NUPL2 | 6550537 | 4252 | 0.022 | 0.7436 | No | ||
| 14 | NUP54 | 940546 2360156 4060278 | 5079 | 0.011 | 0.7019 | No | ||
| 15 | SLBP | 6220601 | 7017 | 0.002 | 0.5983 | No | ||
| 16 | TPR | 1990066 6550390 | 8112 | -0.000 | 0.5396 | No | ||
| 17 | NUP153 | 7000452 | 8185 | -0.001 | 0.5359 | No | ||
| 18 | NUP188 | 1190470 | 9496 | -0.004 | 0.4664 | No | ||
| 19 | NUP35 | 5340408 | 11763 | -0.012 | 0.3477 | No | ||
| 20 | NUP62 | 1240128 | 15205 | -0.083 | 0.1834 | No |