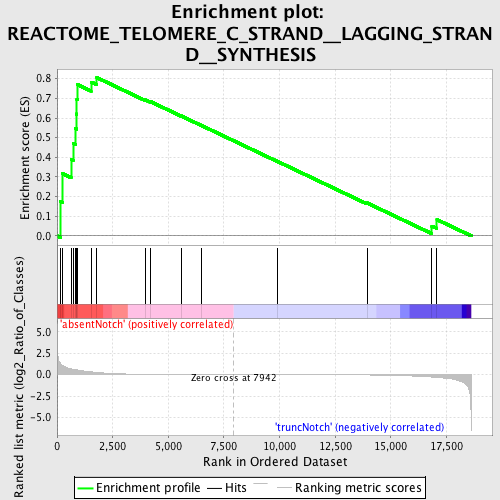
Profile of the Running ES Score & Positions of GeneSet Members on the Rank Ordered List
| Dataset | Set_03_absentNotch_versus_truncNotch.phenotype_absentNotch_versus_truncNotch.cls #absentNotch_versus_truncNotch.phenotype_absentNotch_versus_truncNotch.cls #absentNotch_versus_truncNotch_repos |
| Phenotype | phenotype_absentNotch_versus_truncNotch.cls#absentNotch_versus_truncNotch_repos |
| Upregulated in class | absentNotch |
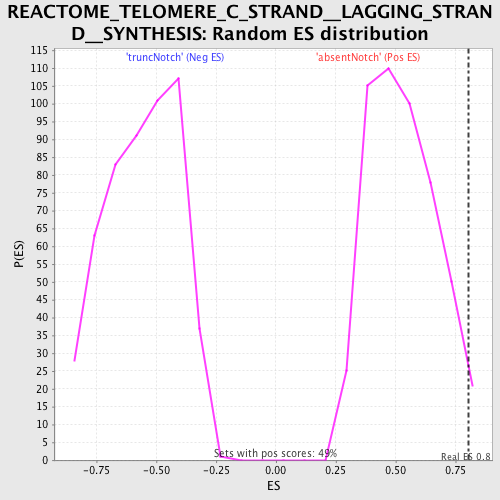
| GeneSet | REACTOME_TELOMERE_C_STRAND__LAGGING_STRAND__SYNTHESIS |
| Enrichment Score (ES) | 0.80564195 |
| Normalized Enrichment Score (NES) | 1.5225725 |
| Nominal p-value | 0.020449897 |
| FDR q-value | 0.36779064 |
| FWER p-Value | 0.983 |
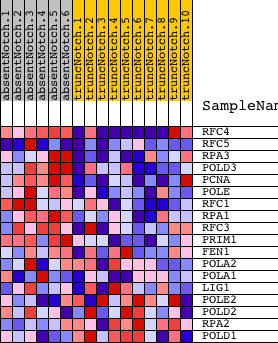
| PROBE | DESCRIPTION (from dataset) | GENE SYMBOL | GENE_TITLE | RANK IN GENE LIST | RANK METRIC SCORE | RUNNING ES | CORE ENRICHMENT | |
|---|---|---|---|---|---|---|---|---|
| 1 | RFC4 | 3800082 6840142 | 145 | 1.314 | 0.1755 | Yes | ||
| 2 | RFC5 | 3800452 6020091 | 236 | 1.048 | 0.3169 | Yes | ||
| 3 | RPA3 | 5700136 | 630 | 0.672 | 0.3895 | Yes | ||
| 4 | POLD3 | 6400278 | 722 | 0.624 | 0.4717 | Yes | ||
| 5 | PCNA | 940754 | 833 | 0.569 | 0.5452 | Yes | ||
| 6 | POLE | 6020538 | 872 | 0.554 | 0.6205 | Yes | ||
| 7 | RFC1 | 1190673 | 888 | 0.547 | 0.6961 | Yes | ||
| 8 | RPA1 | 360452 | 914 | 0.539 | 0.7700 | Yes | ||
| 9 | RFC3 | 1980600 | 1527 | 0.329 | 0.7830 | Yes | ||
| 10 | PRIM1 | 6420746 | 1785 | 0.261 | 0.8056 | Yes | ||
| 11 | FEN1 | 1770541 | 3976 | 0.029 | 0.6920 | No | ||
| 12 | POLA2 | 940519 | 4200 | 0.023 | 0.6832 | No | ||
| 13 | POLA1 | 4760541 | 5570 | 0.008 | 0.6107 | No | ||
| 14 | LIG1 | 1980438 4540112 5570609 | 6510 | 0.004 | 0.5608 | No | ||
| 15 | POLE2 | 6110041 | 9910 | -0.005 | 0.3788 | No | ||
| 16 | POLD2 | 6400148 | 13931 | -0.038 | 0.1679 | No | ||
| 17 | RPA2 | 2760301 5420195 | 16845 | -0.280 | 0.0503 | No | ||
| 18 | POLD1 | 4830026 | 17073 | -0.322 | 0.0830 | No |