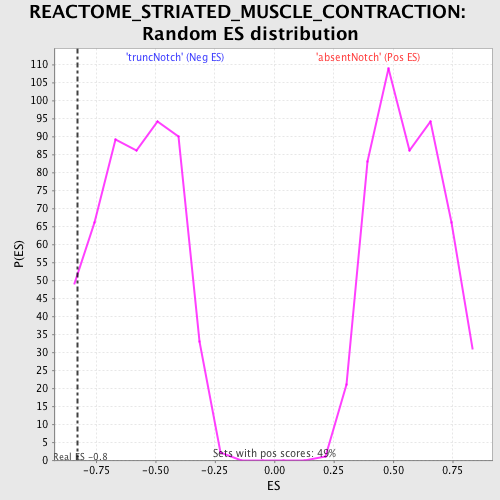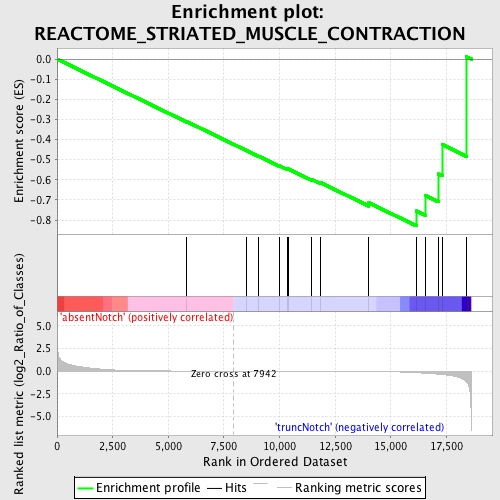
Profile of the Running ES Score & Positions of GeneSet Members on the Rank Ordered List
| Dataset | Set_03_absentNotch_versus_truncNotch.phenotype_absentNotch_versus_truncNotch.cls #absentNotch_versus_truncNotch.phenotype_absentNotch_versus_truncNotch.cls #absentNotch_versus_truncNotch_repos |
| Phenotype | phenotype_absentNotch_versus_truncNotch.cls#absentNotch_versus_truncNotch_repos |
| Upregulated in class | truncNotch |
| GeneSet | REACTOME_STRIATED_MUSCLE_CONTRACTION |
| Enrichment Score (ES) | -0.8291875 |
| Normalized Enrichment Score (NES) | -1.4411429 |
| Nominal p-value | 0.05108055 |
| FDR q-value | 0.5364378 |
| FWER p-Value | 1.0 |
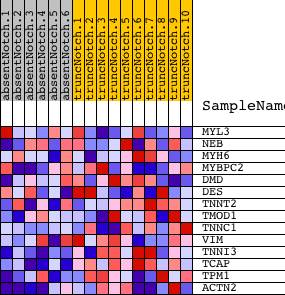
| PROBE | DESCRIPTION (from dataset) | GENE SYMBOL | GENE_TITLE | RANK IN GENE LIST | RANK METRIC SCORE | RUNNING ES | CORE ENRICHMENT | |
|---|---|---|---|---|---|---|---|---|
| 1 | MYL3 | 6040563 | 5829 | 0.007 | -0.3106 | No | ||
| 2 | NEB | 580735 | 8502 | -0.001 | -0.4536 | No | ||
| 3 | MYH6 | 2900373 | 9057 | -0.003 | -0.4822 | No | ||
| 4 | MYBPC2 | 1980368 | 9997 | -0.006 | -0.5304 | No | ||
| 5 | DMD | 1740041 3990332 | 10371 | -0.007 | -0.5477 | No | ||
| 6 | DES | 1450341 | 10384 | -0.007 | -0.5455 | No | ||
| 7 | TNNT2 | 2450364 | 11445 | -0.011 | -0.5979 | No | ||
| 8 | TMOD1 | 3850100 | 11832 | -0.013 | -0.6133 | No | ||
| 9 | TNNC1 | 1990575 | 14012 | -0.039 | -0.7140 | No | ||
| 10 | VIM | 20431 | 16155 | -0.179 | -0.7545 | Yes | ||
| 11 | TNNI3 | 7000093 | 16560 | -0.235 | -0.6783 | Yes | ||
| 12 | TCAP | 4890446 | 17128 | -0.331 | -0.5708 | Yes | ||
| 13 | TPM1 | 130673 | 17317 | -0.374 | -0.4250 | Yes | ||
| 14 | ACTN2 | 4200435 | 18409 | -1.188 | 0.0111 | Yes |