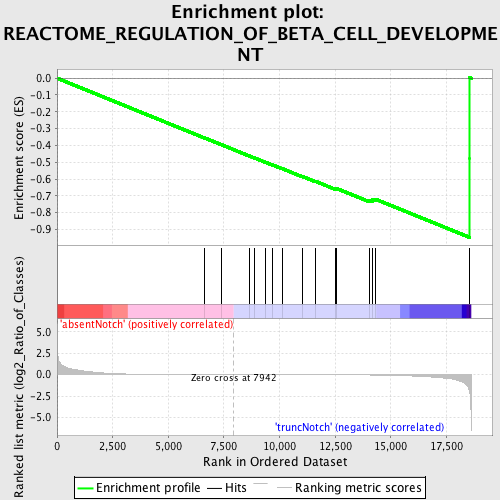
Profile of the Running ES Score & Positions of GeneSet Members on the Rank Ordered List
| Dataset | Set_03_absentNotch_versus_truncNotch.phenotype_absentNotch_versus_truncNotch.cls #absentNotch_versus_truncNotch.phenotype_absentNotch_versus_truncNotch.cls #absentNotch_versus_truncNotch_repos |
| Phenotype | phenotype_absentNotch_versus_truncNotch.cls#absentNotch_versus_truncNotch_repos |
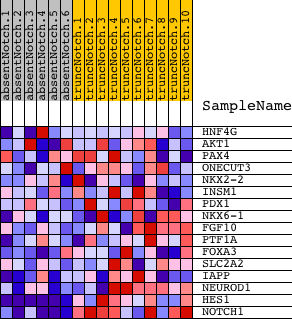
| Upregulated in class | truncNotch |
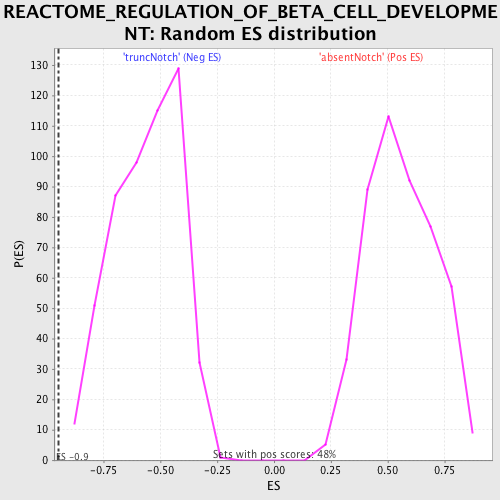
| GeneSet | REACTOME_REGULATION_OF_BETA_CELL_DEVELOPMENT |
| Enrichment Score (ES) | -0.94785655 |
| Normalized Enrichment Score (NES) | -1.6965823 |
| Nominal p-value | 0.0 |
| FDR q-value | 0.083945185 |
| FWER p-Value | 0.1 |
| PROBE | DESCRIPTION (from dataset) | GENE SYMBOL | GENE_TITLE | RANK IN GENE LIST | RANK METRIC SCORE | RUNNING ES | CORE ENRICHMENT | |
|---|---|---|---|---|---|---|---|---|
| 1 | HNF4G | 5720451 | 6623 | 0.004 | -0.3552 | No | ||
| 2 | AKT1 | 5290746 | 7384 | 0.001 | -0.3957 | No | ||
| 3 | PAX4 | 6620619 | 8662 | -0.002 | -0.4640 | No | ||
| 4 | ONECUT3 | 5720487 6100037 | 8877 | -0.002 | -0.4750 | No | ||
| 5 | NKX2-2 | 4150731 | 9357 | -0.004 | -0.4999 | No | ||
| 6 | INSM1 | 3450671 | 9687 | -0.005 | -0.5165 | No | ||
| 7 | PDX1 | 6660647 | 10117 | -0.006 | -0.5382 | No | ||
| 8 | NKX6-1 | 6040731 | 11018 | -0.009 | -0.5846 | No | ||
| 9 | FGF10 | 730458 840706 | 11618 | -0.012 | -0.6141 | No | ||
| 10 | PTF1A | 6450377 | 12520 | -0.018 | -0.6584 | No | ||
| 11 | FOXA3 | 2680121 | 12559 | -0.018 | -0.6562 | No | ||
| 12 | SLC2A2 | 5130537 5720722 6770079 | 14041 | -0.040 | -0.7266 | Yes | ||
| 13 | IAPP | 4230040 | 14165 | -0.043 | -0.7232 | Yes | ||
| 14 | NEUROD1 | 3060619 | 14295 | -0.047 | -0.7193 | Yes | ||
| 15 | HES1 | 4810280 | 18547 | -2.042 | -0.4773 | Yes | ||
| 16 | NOTCH1 | 3390114 | 18550 | -2.087 | 0.0035 | Yes |