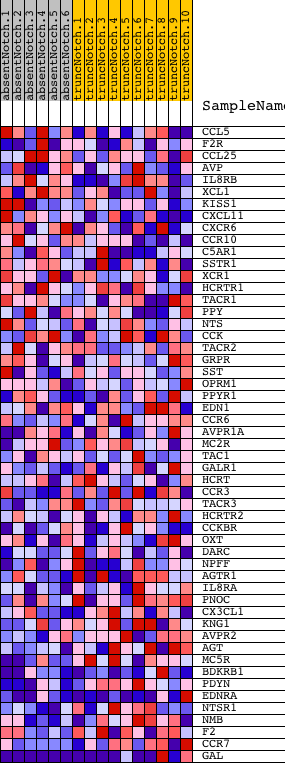
Profile of the Running ES Score & Positions of GeneSet Members on the Rank Ordered List
| Dataset | Set_03_absentNotch_versus_truncNotch.phenotype_absentNotch_versus_truncNotch.cls #absentNotch_versus_truncNotch.phenotype_absentNotch_versus_truncNotch.cls #absentNotch_versus_truncNotch_repos |
| Phenotype | phenotype_absentNotch_versus_truncNotch.cls#absentNotch_versus_truncNotch_repos |
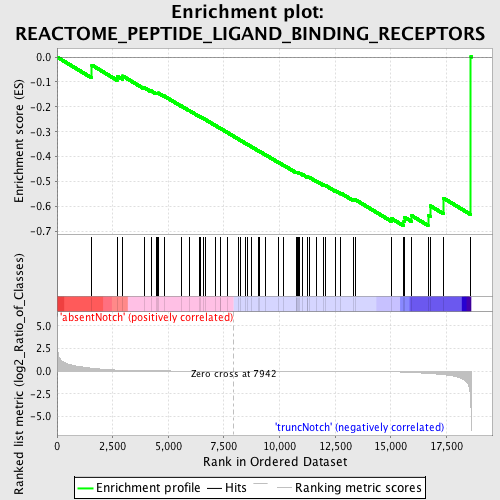
| Upregulated in class | truncNotch |
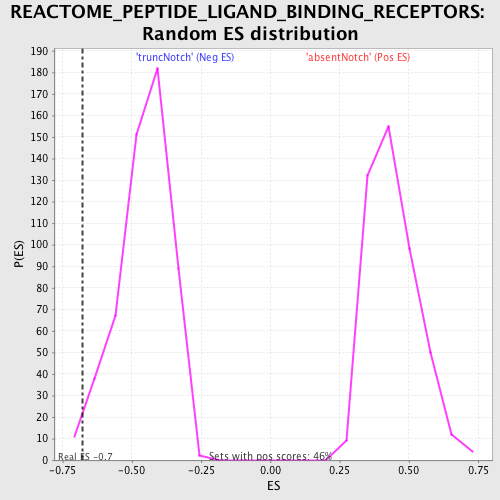
| GeneSet | REACTOME_PEPTIDE_LIGAND_BINDING_RECEPTORS |
| Enrichment Score (ES) | -0.6786257 |
| Normalized Enrichment Score (NES) | -1.4907982 |
| Nominal p-value | 0.016666668 |
| FDR q-value | 0.44314763 |
| FWER p-Value | 0.999 |
| PROBE | DESCRIPTION (from dataset) | GENE SYMBOL | GENE_TITLE | RANK IN GENE LIST | RANK METRIC SCORE | RUNNING ES | CORE ENRICHMENT | |
|---|---|---|---|---|---|---|---|---|
| 1 | CCL5 | 3710397 | 1562 | 0.321 | -0.0323 | No | ||
| 2 | F2R | 4810180 | 2696 | 0.107 | -0.0761 | No | ||
| 3 | CCL25 | 450541 540435 | 2948 | 0.084 | -0.0760 | No | ||
| 4 | AVP | 2100113 | 3908 | 0.032 | -0.1225 | No | ||
| 5 | IL8RB | 450592 1170537 | 4225 | 0.023 | -0.1359 | No | ||
| 6 | XCL1 | 3800504 | 4457 | 0.018 | -0.1454 | No | ||
| 7 | KISS1 | 1580398 | 4505 | 0.018 | -0.1451 | No | ||
| 8 | CXCL11 | 1090551 | 4541 | 0.017 | -0.1442 | No | ||
| 9 | CXCR6 | 3190440 | 4804 | 0.014 | -0.1562 | No | ||
| 10 | CCR10 | 4050097 | 5569 | 0.008 | -0.1960 | No | ||
| 11 | C5AR1 | 4540402 | 5928 | 0.006 | -0.2143 | No | ||
| 12 | SSTR1 | 2630471 | 6414 | 0.004 | -0.2397 | No | ||
| 13 | XCR1 | 5080072 | 6456 | 0.004 | -0.2413 | No | ||
| 14 | HCRTR1 | 1580273 | 6561 | 0.004 | -0.2462 | No | ||
| 15 | TACR1 | 70358 3840411 | 6667 | 0.004 | -0.2513 | No | ||
| 16 | PPY | 2340373 | 7121 | 0.002 | -0.2754 | No | ||
| 17 | NTS | 380300 2120592 | 7341 | 0.002 | -0.2869 | No | ||
| 18 | CCK | 6370368 | 7345 | 0.002 | -0.2868 | No | ||
| 19 | TACR2 | 1740358 | 7671 | 0.001 | -0.3042 | No | ||
| 20 | GRPR | 6020170 | 8154 | -0.000 | -0.3301 | No | ||
| 21 | SST | 6590142 | 8260 | -0.001 | -0.3357 | No | ||
| 22 | OPRM1 | 5360279 | 8473 | -0.001 | -0.3469 | No | ||
| 23 | PPYR1 | 1410072 | 8566 | -0.002 | -0.3516 | No | ||
| 24 | EDN1 | 1770047 | 8742 | -0.002 | -0.3607 | No | ||
| 25 | CCR6 | 5720368 6020176 | 9058 | -0.003 | -0.3772 | No | ||
| 26 | AVPR1A | 2120300 | 9113 | -0.003 | -0.3796 | No | ||
| 27 | MC2R | 2970504 | 9388 | -0.004 | -0.3938 | No | ||
| 28 | TAC1 | 7000195 380706 | 9968 | -0.005 | -0.4241 | No | ||
| 29 | GALR1 | 6020452 | 10191 | -0.006 | -0.4351 | No | ||
| 30 | HCRT | 2970463 | 10755 | -0.008 | -0.4641 | No | ||
| 31 | CCR3 | 50427 | 10780 | -0.008 | -0.4641 | No | ||
| 32 | TACR3 | 4780017 | 10811 | -0.008 | -0.4644 | No | ||
| 33 | HCRTR2 | 2350463 | 10833 | -0.008 | -0.4642 | No | ||
| 34 | CCKBR | 2760128 | 10913 | -0.009 | -0.4671 | No | ||
| 35 | OXT | 3850692 | 11047 | -0.009 | -0.4728 | No | ||
| 36 | DARC | 3940050 | 11233 | -0.010 | -0.4812 | No | ||
| 37 | NPFF | 2030280 | 11272 | -0.010 | -0.4816 | No | ||
| 38 | AGTR1 | 4780524 2680592 | 11345 | -0.010 | -0.4838 | No | ||
| 39 | IL8RA | 1580100 | 11646 | -0.012 | -0.4980 | No | ||
| 40 | PNOC | 1990114 | 11962 | -0.014 | -0.5128 | No | ||
| 41 | CX3CL1 | 3990707 | 12044 | -0.014 | -0.5149 | No | ||
| 42 | KNG1 | 6400576 6770347 | 12499 | -0.018 | -0.5364 | No | ||
| 43 | AVPR2 | 360064 | 12757 | -0.020 | -0.5470 | No | ||
| 44 | AGT | 7000575 | 13334 | -0.027 | -0.5737 | No | ||
| 45 | MC5R | 2640176 | 13413 | -0.028 | -0.5734 | No | ||
| 46 | BDKRB1 | 730592 | 15016 | -0.073 | -0.6479 | No | ||
| 47 | PDYN | 5720408 | 15587 | -0.112 | -0.6606 | Yes | ||
| 48 | EDNRA | 6900133 | 15620 | -0.114 | -0.6439 | Yes | ||
| 49 | NTSR1 | 6510136 | 15931 | -0.148 | -0.6367 | Yes | ||
| 50 | NMB | 3360735 | 16676 | -0.252 | -0.6360 | Yes | ||
| 51 | F2 | 5720280 | 16781 | -0.270 | -0.5980 | Yes | ||
| 52 | CCR7 | 2060687 | 17376 | -0.388 | -0.5673 | Yes | ||
| 53 | GAL | 3930279 | 18601 | -3.926 | 0.0008 | Yes |