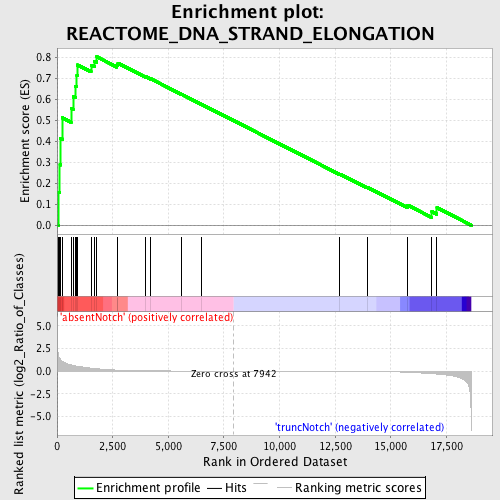
Profile of the Running ES Score & Positions of GeneSet Members on the Rank Ordered List
| Dataset | Set_03_absentNotch_versus_truncNotch.phenotype_absentNotch_versus_truncNotch.cls #absentNotch_versus_truncNotch.phenotype_absentNotch_versus_truncNotch.cls #absentNotch_versus_truncNotch_repos |
| Phenotype | phenotype_absentNotch_versus_truncNotch.cls#absentNotch_versus_truncNotch_repos |
| Upregulated in class | absentNotch |
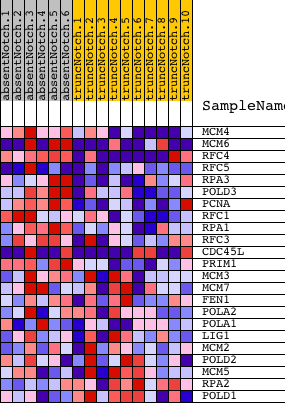
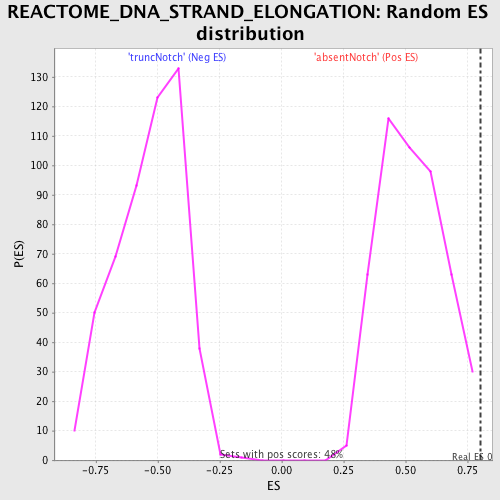
| GeneSet | REACTOME_DNA_STRAND_ELONGATION |
| Enrichment Score (ES) | 0.8013164 |
| Normalized Enrichment Score (NES) | 1.518888 |
| Nominal p-value | 0.008316008 |
| FDR q-value | 0.34166196 |
| FWER p-Value | 0.983 |
| PROBE | DESCRIPTION (from dataset) | GENE SYMBOL | GENE_TITLE | RANK IN GENE LIST | RANK METRIC SCORE | RUNNING ES | CORE ENRICHMENT | |
|---|---|---|---|---|---|---|---|---|
| 1 | MCM4 | 2760673 5420711 | 68 | 1.651 | 0.1570 | Yes | ||
| 2 | MCM6 | 60092 540181 6510110 | 128 | 1.370 | 0.2873 | Yes | ||
| 3 | RFC4 | 3800082 6840142 | 145 | 1.314 | 0.4143 | Yes | ||
| 4 | RFC5 | 3800452 6020091 | 236 | 1.048 | 0.5115 | Yes | ||
| 5 | RPA3 | 5700136 | 630 | 0.672 | 0.5558 | Yes | ||
| 6 | POLD3 | 6400278 | 722 | 0.624 | 0.6117 | Yes | ||
| 7 | PCNA | 940754 | 833 | 0.569 | 0.6612 | Yes | ||
| 8 | RFC1 | 1190673 | 888 | 0.547 | 0.7116 | Yes | ||
| 9 | RPA1 | 360452 | 914 | 0.539 | 0.7627 | Yes | ||
| 10 | RFC3 | 1980600 | 1527 | 0.329 | 0.7619 | Yes | ||
| 11 | CDC45L | 70537 3130114 | 1679 | 0.285 | 0.7816 | Yes | ||
| 12 | PRIM1 | 6420746 | 1785 | 0.261 | 0.8013 | Yes | ||
| 13 | MCM3 | 5570068 | 2691 | 0.107 | 0.7631 | No | ||
| 14 | MCM7 | 3290292 5220056 | 2733 | 0.103 | 0.7710 | No | ||
| 15 | FEN1 | 1770541 | 3976 | 0.029 | 0.7070 | No | ||
| 16 | POLA2 | 940519 | 4200 | 0.023 | 0.6973 | No | ||
| 17 | POLA1 | 4760541 | 5570 | 0.008 | 0.6244 | No | ||
| 18 | LIG1 | 1980438 4540112 5570609 | 6510 | 0.004 | 0.5743 | No | ||
| 19 | MCM2 | 5050139 | 12705 | -0.020 | 0.2431 | No | ||
| 20 | POLD2 | 6400148 | 13931 | -0.038 | 0.1809 | No | ||
| 21 | MCM5 | 2680647 | 15739 | -0.127 | 0.0961 | No | ||
| 22 | RPA2 | 2760301 5420195 | 16845 | -0.280 | 0.0639 | No | ||
| 23 | POLD1 | 4830026 | 17073 | -0.322 | 0.0830 | No |