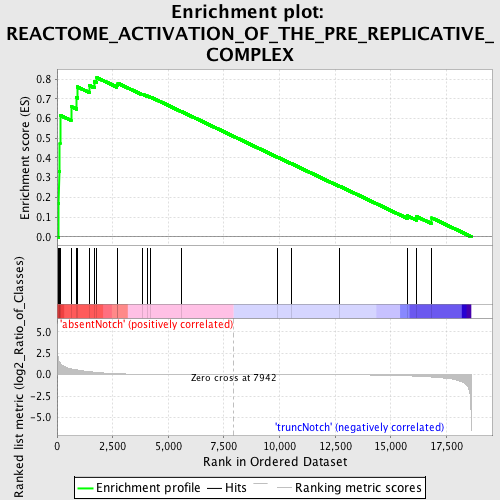
Profile of the Running ES Score & Positions of GeneSet Members on the Rank Ordered List
| Dataset | Set_03_absentNotch_versus_truncNotch.phenotype_absentNotch_versus_truncNotch.cls #absentNotch_versus_truncNotch.phenotype_absentNotch_versus_truncNotch.cls #absentNotch_versus_truncNotch_repos |
| Phenotype | phenotype_absentNotch_versus_truncNotch.cls#absentNotch_versus_truncNotch_repos |
| Upregulated in class | absentNotch |
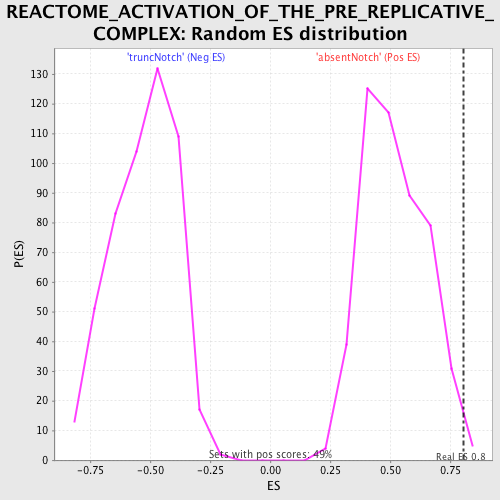
| GeneSet | REACTOME_ACTIVATION_OF_THE_PRE_REPLICATIVE_COMPLEX |
| Enrichment Score (ES) | 0.80763304 |
| Normalized Enrichment Score (NES) | 1.5580975 |
| Nominal p-value | 0.010224949 |
| FDR q-value | 0.38788545 |
| FWER p-Value | 0.914 |
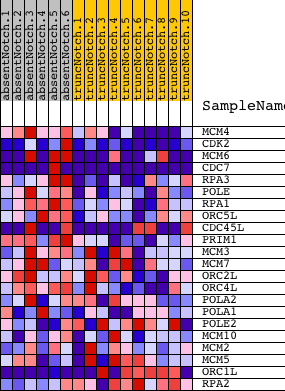
| PROBE | DESCRIPTION (from dataset) | GENE SYMBOL | GENE_TITLE | RANK IN GENE LIST | RANK METRIC SCORE | RUNNING ES | CORE ENRICHMENT | |
|---|---|---|---|---|---|---|---|---|
| 1 | MCM4 | 2760673 5420711 | 68 | 1.651 | 0.1699 | Yes | ||
| 2 | CDK2 | 130484 2260301 4010088 5050110 | 84 | 1.554 | 0.3324 | Yes | ||
| 3 | MCM6 | 60092 540181 6510110 | 128 | 1.370 | 0.4740 | Yes | ||
| 4 | CDC7 | 4060546 4850041 | 133 | 1.359 | 0.6167 | Yes | ||
| 5 | RPA3 | 5700136 | 630 | 0.672 | 0.6606 | Yes | ||
| 6 | POLE | 6020538 | 872 | 0.554 | 0.7059 | Yes | ||
| 7 | RPA1 | 360452 | 914 | 0.539 | 0.7604 | Yes | ||
| 8 | ORC5L | 1940133 1940711 | 1454 | 0.347 | 0.7679 | Yes | ||
| 9 | CDC45L | 70537 3130114 | 1679 | 0.285 | 0.7858 | Yes | ||
| 10 | PRIM1 | 6420746 | 1785 | 0.261 | 0.8076 | Yes | ||
| 11 | MCM3 | 5570068 | 2691 | 0.107 | 0.7702 | No | ||
| 12 | MCM7 | 3290292 5220056 | 2733 | 0.103 | 0.7789 | No | ||
| 13 | ORC2L | 1990470 6510019 | 3821 | 0.035 | 0.7241 | No | ||
| 14 | ORC4L | 4230538 5550288 | 4055 | 0.027 | 0.7144 | No | ||
| 15 | POLA2 | 940519 | 4200 | 0.023 | 0.7091 | No | ||
| 16 | POLA1 | 4760541 | 5570 | 0.008 | 0.6363 | No | ||
| 17 | POLE2 | 6110041 | 9910 | -0.005 | 0.4035 | No | ||
| 18 | MCM10 | 4920632 | 10531 | -0.007 | 0.3709 | No | ||
| 19 | MCM2 | 5050139 | 12705 | -0.020 | 0.2561 | No | ||
| 20 | MCM5 | 2680647 | 15739 | -0.127 | 0.1064 | No | ||
| 21 | ORC1L | 2370328 6110390 | 16154 | -0.179 | 0.1029 | No | ||
| 22 | RPA2 | 2760301 5420195 | 16845 | -0.280 | 0.0952 | No |