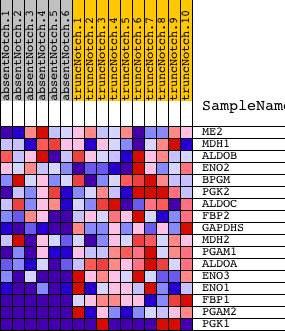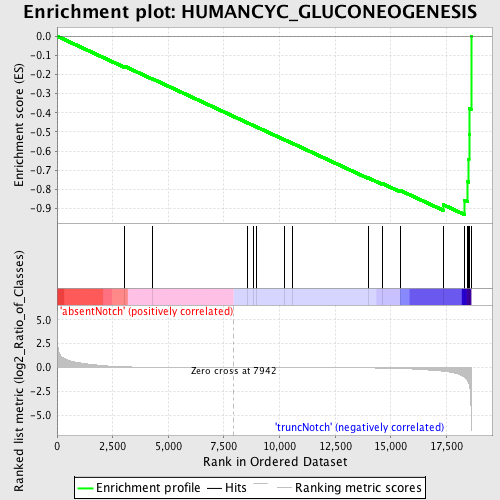
Profile of the Running ES Score & Positions of GeneSet Members on the Rank Ordered List
| Dataset | Set_03_absentNotch_versus_truncNotch.phenotype_absentNotch_versus_truncNotch.cls #absentNotch_versus_truncNotch.phenotype_absentNotch_versus_truncNotch.cls #absentNotch_versus_truncNotch_repos |
| Phenotype | phenotype_absentNotch_versus_truncNotch.cls#absentNotch_versus_truncNotch_repos |
| Upregulated in class | truncNotch |
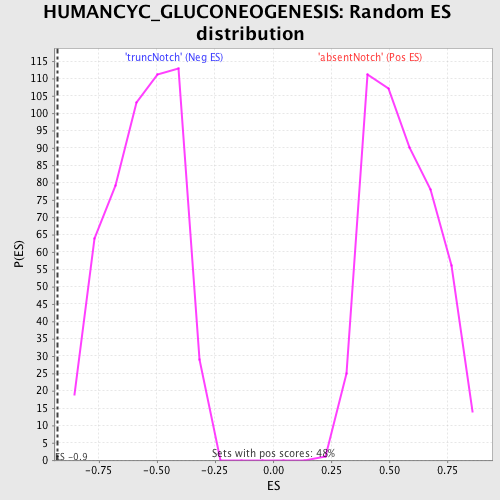
| GeneSet | HUMANCYC_GLUCONEOGENESIS |
| Enrichment Score (ES) | -0.9304227 |
| Normalized Enrichment Score (NES) | -1.6677716 |
| Nominal p-value | 0.0 |
| FDR q-value | 0.090551615 |
| FWER p-Value | 0.204 |
| PROBE | DESCRIPTION (from dataset) | GENE SYMBOL | GENE_TITLE | RANK IN GENE LIST | RANK METRIC SCORE | RUNNING ES | CORE ENRICHMENT | |
|---|---|---|---|---|---|---|---|---|
| 1 | ME2 | 5080121 | 3029 | 0.078 | -0.1568 | No | ||
| 2 | MDH1 | 6660358 6760731 | 4297 | 0.021 | -0.2234 | No | ||
| 3 | ALDOB | 4730324 | 8552 | -0.001 | -0.4519 | No | ||
| 4 | ENO2 | 2320068 | 8815 | -0.002 | -0.4659 | No | ||
| 5 | BPGM | 5080520 | 8957 | -0.003 | -0.4733 | No | ||
| 6 | PGK2 | 2650091 | 10207 | -0.006 | -0.5399 | No | ||
| 7 | ALDOC | 450121 610427 | 10575 | -0.007 | -0.5591 | No | ||
| 8 | FBP2 | 1580193 | 13986 | -0.039 | -0.7395 | No | ||
| 9 | GAPDHS | 2690463 | 14608 | -0.056 | -0.7686 | No | ||
| 10 | MDH2 | 1850601 | 15423 | -0.097 | -0.8049 | No | ||
| 11 | PGAM1 | 2570133 | 17350 | -0.383 | -0.8792 | Yes | ||
| 12 | ALDOA | 6290672 | 18304 | -0.964 | -0.8567 | Yes | ||
| 13 | ENO3 | 5270136 | 18458 | -1.372 | -0.7599 | Yes | ||
| 14 | ENO1 | 5340128 | 18494 | -1.566 | -0.6419 | Yes | ||
| 15 | FBP1 | 1470762 | 18514 | -1.688 | -0.5138 | Yes | ||
| 16 | PGAM2 | 3610605 | 18524 | -1.782 | -0.3780 | Yes | ||
| 17 | PGK1 | 1570494 630300 | 18610 | -5.004 | 0.0003 | Yes |