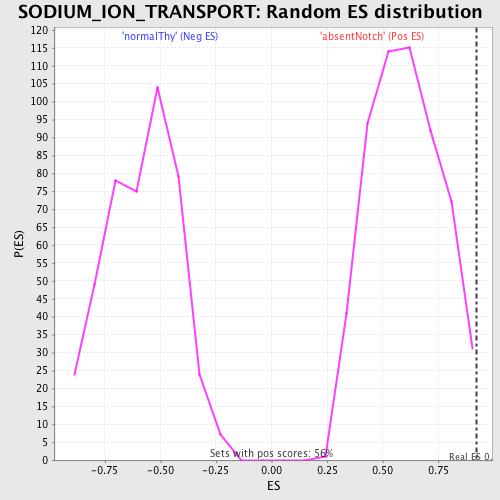
Profile of the Running ES Score & Positions of GeneSet Members on the Rank Ordered List
| Dataset | Set_03_absentNotch_versus_normalThy.phenotype_absentNotch_versus_normalThy.cls #absentNotch_versus_normalThy.phenotype_absentNotch_versus_normalThy.cls #absentNotch_versus_normalThy_repos |
| Phenotype | phenotype_absentNotch_versus_normalThy.cls#absentNotch_versus_normalThy_repos |
| Upregulated in class | absentNotch |
| GeneSet | SODIUM_ION_TRANSPORT |
| Enrichment Score (ES) | 0.9241261 |
| Normalized Enrichment Score (NES) | 1.5293267 |
| Nominal p-value | 0.0035714286 |
| FDR q-value | 0.27366173 |
| FWER p-Value | 0.96 |
| PROBE | DESCRIPTION (from dataset) | GENE SYMBOL | GENE_TITLE | RANK IN GENE LIST | RANK METRIC SCORE | RUNNING ES | CORE ENRICHMENT | |
|---|---|---|---|---|---|---|---|---|
| 1 | SCN5A | 4070017 | 269 | 1.622 | 0.9241 | Yes | ||
| 2 | SLC8A1 | 3440717 | 5021 | 0.025 | 0.6834 | No | ||
| 3 | SCN4A | 5340687 | 5938 | 0.015 | 0.6430 | No | ||
| 4 | SLC17A2 | 870593 2810035 | 8566 | 0.004 | 0.5039 | No | ||
| 5 | SCN11A | 2480372 | 8595 | 0.003 | 0.5044 | No | ||
| 6 | SCN10A | 4760242 | 9088 | 0.002 | 0.4791 | No | ||
| 7 | SCN9A | 5270575 | 9862 | -0.000 | 0.4376 | No | ||
| 8 | SLC17A3 | 1780463 5670435 | 10366 | -0.002 | 0.4115 | No | ||
| 9 | SCNN1G | 520600 | 10912 | -0.003 | 0.3841 | No | ||
| 10 | SCN7A | 2510538 | 11054 | -0.004 | 0.3786 | No | ||
| 11 | SCNN1A | 4730019 | 12586 | -0.010 | 0.3021 | No | ||
| 12 | SCN1B | 1240022 2120048 | 12903 | -0.012 | 0.2919 | No | ||
| 13 | SLC34A3 | 2230242 | 14203 | -0.026 | 0.2372 | No |