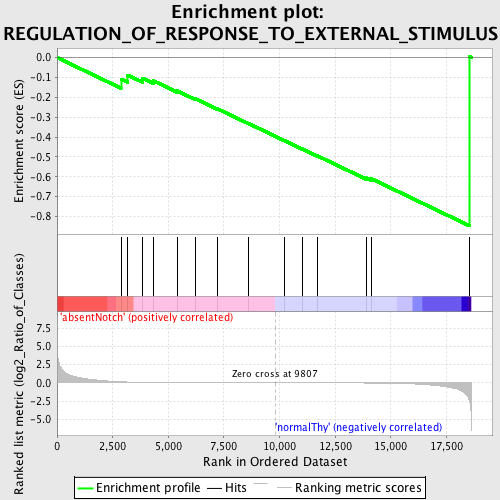
Profile of the Running ES Score & Positions of GeneSet Members on the Rank Ordered List
| Dataset | Set_03_absentNotch_versus_normalThy.phenotype_absentNotch_versus_normalThy.cls #absentNotch_versus_normalThy.phenotype_absentNotch_versus_normalThy.cls #absentNotch_versus_normalThy_repos |
| Phenotype | phenotype_absentNotch_versus_normalThy.cls#absentNotch_versus_normalThy_repos |
| Upregulated in class | normalThy |
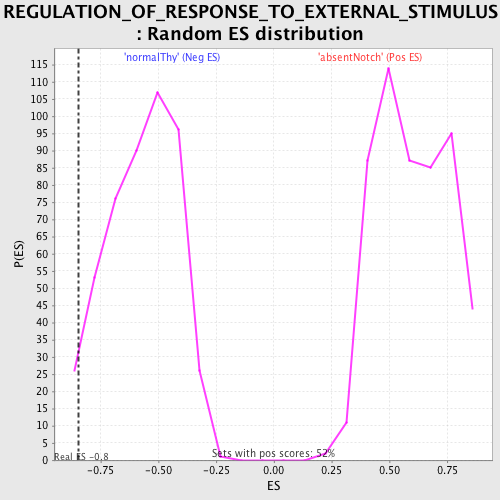
| GeneSet | REGULATION_OF_RESPONSE_TO_EXTERNAL_STIMULUS |
| Enrichment Score (ES) | -0.8475431 |
| Normalized Enrichment Score (NES) | -1.4863048 |
| Nominal p-value | 0.03368421 |
| FDR q-value | 0.5257472 |
| FWER p-Value | 1.0 |
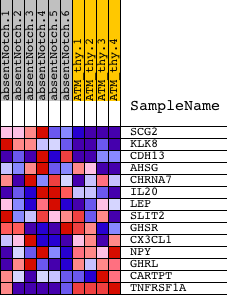
| PROBE | DESCRIPTION (from dataset) | GENE SYMBOL | GENE_TITLE | RANK IN GENE LIST | RANK METRIC SCORE | RUNNING ES | CORE ENRICHMENT | |
|---|---|---|---|---|---|---|---|---|
| 1 | SCG2 | 5670438 130671 | 2873 | 0.143 | -0.1081 | No | ||
| 2 | KLK8 | 60035 2340440 | 3172 | 0.110 | -0.0882 | No | ||
| 3 | CDH13 | 5130368 5340114 | 3843 | 0.061 | -0.1043 | No | ||
| 4 | AHSG | 6450014 | 4337 | 0.041 | -0.1173 | No | ||
| 5 | CHRNA7 | 2970446 | 5390 | 0.020 | -0.1673 | No | ||
| 6 | IL20 | 4850647 | 6203 | 0.013 | -0.2066 | No | ||
| 7 | LEP | 4010053 | 7212 | 0.008 | -0.2582 | No | ||
| 8 | SLIT2 | 1940037 | 8580 | 0.004 | -0.3305 | No | ||
| 9 | GHSR | 1980465 7050521 | 10218 | -0.001 | -0.4181 | No | ||
| 10 | CX3CL1 | 3990707 | 11020 | -0.004 | -0.4600 | No | ||
| 11 | NPY | 3170138 | 11694 | -0.006 | -0.4943 | No | ||
| 12 | GHRL | 2360619 6760438 | 13902 | -0.021 | -0.6059 | No | ||
| 13 | CARTPT | 6660687 | 14127 | -0.025 | -0.6098 | Yes | ||
| 14 | TNFRSF1A | 1090390 6520735 | 18550 | -2.617 | 0.0035 | Yes |